L B T

记 录 过 去 的 经 验

环境信息

  • Centos 7 6.3.8-1.el7.elrepo.x86_64
  • Python 3.10.12

编译安装步骤

安装相关依赖

yum -y groupinstall "Development tools"

yum -y install zlib-devel bzip2-devel openssl-devel ncurses-devel sqlite-devel readline-devel tk-devel gdbm-devel db4-devel libpcap-devel xz-devel

yum install libffi-devel -y

Centos 7 默认安装的 openssl 版本太低(1.0.2k-fips),无法满足 Python 3.10.12 对 SSL 的支持,需要 首先升级 OpenSSL 版本。否则编译安装后使用 SSL 相关功能会报错: ImportError: No module named _ssl

下载安装包并编译安装。使用 --with-openssl=/usr/local/openssl/ 指定新版本 openssl 位置

wget https://www.python.org/ftp/python/3.10.12/Python-3.10.12.tgz

tar -xf Python-3.10.12.tgz

cd Python-3.10.12

./configure --prefix=/usr/local/python3 --with-openssl=/usr/local/openssl/

make && make install

ln -s /usr/local/python3/bin/python3 /usr/bin/
ln -s /usr/local/python3/bin/pip3 /usr/bin/

安装完成后,安装目录为 /usr/local/python3,要迁移到其他机器使用,可以安装相关依赖后,将安装目录拷贝到其他机器即可正常使用。此版本编译后的文件下载链接

环境信息

  • Prometheus 2.44.0
  • Grafana 9.5.2
  • Kubernetes 1.24

Kubernetes

CPU

Grafana 中获取所有 node 的 CPU 使用率

以下示例中,$node 为在 Grafana 的 Dashboard 中配置的 Variables,其值为 Kubernetes 的节点主机名。$interval 为在 Grafana 的 Dashboard 中配置的 Variables,其值表示 Prometheus 的查询时间范围变量。

100 - avg(rate(node_cpu_seconds_total{mode="idle",kubernetes_io_hostname=~"$node"}[$interval])) * 100

Memory

Grafana 中获取所有 node 的 Memory 使用率

100 - (sum(node_memory_MemFree_bytes{kubernetes_io_hostname=~"$node"}) + sum(node_memory_Cached_bytes{kubernetes_io_hostname=~"$node"}) + sum(node_memory_Buffers_bytes{kubernetes_io_hostname=~"$node"})) / sum(node_memory_MemTotal_bytes{kubernetes_io_hostname=~"$node"}) * 100

Disk

Grafana 中获取所有 node 的 Disk 使用率

100 - (sum(node_filesystem_avail_bytes{kubernetes_io_hostname=~"$node"}) / sum(node_filesystem_size_bytes{kubernetes_io_hostname=~"$node"})) * 100

Network

统计节点物理网卡的流入流出流量

irate(node_network_receive_bytes_total{device!~"cni0|docker.*|flannel.*|veth.*|virbr.*|lo",kubernetes_io_hostname=~"$node"}[$prometheusTimeInterval])

irate(node_network_transmit_bytes_total{device!~"cni0|docker.*|flannel.*|veth.*|virbr.*|lo",kubernetes_io_hostname=~"$node"}[$prometheusTimeInterval])

Pod

计算集群中可以使用的 Pod 的数量

相关指标参考说明

100 - sum(kubelet_running_pods{kubernetes_io_hostname=~"$node"}) / sum(kube_node_status_capacity{resource="pods",node=~"$node"}) * 100

按照 namespace 及 Pod 统计 Pod CPU 使用率

sum(rate(container_cpu_usage_seconds_total[1m])) by (namespace, pod)

统计 Pod 使用的内存

container_memory_usage_bytes

统计 Pods 的流量

irate(container_network_receive_bytes_total{namespace=~"$k8sNamespace",interface="eth0",kubernetes_io_hostname=~"$node"}[$prometheusTimeInterval])

统计 Pods 的重启次数

sum(kube_pod_container_status_restarts_total{namespace=~"$k8sNamespace"}) by (namespace,container)

环境信息

  • Centos 7

安装

  • 使用系统软件包管理器安装

    yum install -y inotify-tools

    安装后包含2个命令: inotifywait , inotifywatch,较为常用的命令是 inotifywait

  • 编译安装
    此处安装版本 3.22.6.0 [1]

    wget https://github.com/inotify-tools/inotify-tools/archive/refs/tags/3.22.6.0.tar.gz
    tar -xf 3.22.6.0.tar.gz
    cd inotify-tools-3.22.6.0/
    yum install -y dh-autoreconf
    ./autogen.sh && ./configure --prefix=/usr/local/inotify-tools-3.22.6.0 && make && su -c 'make install'
阅读全文 »

环境信息

  • Centos 7
  • fswatch-1.17.1

安装

Centos 7 默认安装的 gcc 版本太低,无法满足 fswatch-1.17.1 的编译配置要求,需要首先升级 gcc 版本,本示例中 gcc-8.3.0 安装位置为 /usr/local/gcc-8.3.0/,如果系统安装的 gcc 版本符合要求,无需在 ./configure 时指定 gcc 环境变量 CXX=/usr/local/gcc-8.3.0/bin/g++

wget https://github.com/emcrisostomo/fswatch/archive/refs/tags/1.17.1.tar.gz
tar -xf 1.17.1.tar.gz
cd fswatch-1.17.1/
sh autogen.sh

./configure CXX=/usr/local/gcc-8.3.0/bin/g++ --prefix=/usr/local/fswatch-1.17.1

make
make install

使用

常用选项。参考文档安装 man 手册 后可以查看详细的帮助文档

fswatch 会为监控到的每条事件记录以下信息

  • timestamp - 事件发生的时间戳
  • path - 触发事件的文件(夹)路径
  • event types - 空格分割的事件类型
选项 说明 示例
-0, --print0 ASCII NUL character (\0) as line separator
Since file names can potentially contain any character but NUL, this option assures that the output of fswatch can be safely parsed using NUL as delimiter, such as using xargs -0 and the shell builtin read -d ''.
使用示例
-1, --one-event Exit fswatch after the first set of events is received
--event name can be used multiple times
-e, --exclude regexp Exclude paths matching regexp, Multiple exclude filters can be specified using this option multiple times
-i, --include regexp Include paths matching regexp
-f, --format-time format Print the event time using the specified format
-I, --insensitive Use case insensitive regular expressions
-m, --monitor name Uses the monitor specified by name
可用的 monitor:
- inotify_monitor
- poll_monitor
-r, --recursive Watch subdirectories recursively
-t, --timestamp Print the event timestamp.
-u, --utf-time Print the event time in UTC format. When this option is not specified, the time is printed using the system local time, as defined by localtime
-l, --latency latency 监听间隔,默认1s

常用事件

事件 说明 示例
NoOp Idle event, optionally issued when no changes were detected
Created The object has been created.
Updated The object has been updated. The kind of update is monitor-dependent.
Removed The object has been removed.
Renamed The object has been renamed.
OwnerModified The object’s owner has changed.
AttributeModified An object’s attribute has changed.
MovedFrom The object has moved from this location to a new location of the same file system.
MovedTo The object has moved from another location in the same file system into this location.
IsFile The object is a regular file.
IsDir The object is a directory.
IsSymLink The object is a symbolic link.
Link The object link count has changed.
Overflow The monitor has overflowed.

使用示例

输出事件的行分隔符

以下示例中监视文件 nohup.out,输出事件的每一行使用 \0 分割,read 读取时也使用 \0 ("") 分割,可以防止文件名中包含了空格,使用 read 时读取文件名不全。

$ fswatch -0 nohup.out | while read -d "" file; do echo ${file}; done
/root/nohup.out
/root/nohup.out
/root/nohup.out

使用 xargs 处理监听事件

$ fswatch -0 [opts] [paths] | xargs -0 -n 1 -I {} [command]

  • fswatch -0 will split records using the NUL character.

  • xargs -0 will split records using the NUL character. This is required to correctly match impedance with fswatch.

  • xargs -n 1 will invoke command every record. If you want to do it every x records, then use xargs -n x.

  • xargs -I {} will substitute occurrences of {} in command with the parsed argument. If the command you are running
    does not need the event path name, just delete this option. If you prefer using another replacement string, substi‐
    tute {} with yours.

以下示例监视文件变化后进行备份

fswatch -0 nohup.out | xargs -0 -I {} cp {} {}.`date +%Y%m%d%H%M%S`

以上命令中 date +%Y%m%d%H%M%S 只会被计算一次,假如第一次执行时 date +%Y%m%d%H%M%S = nohup.out.20230609132143,那么之后每次触发 xargs,变量 date +%Y%m%d%H%M%S 的值都是 nohup.out.20230609132143不会被重新计算

常见问题

Event queue overflow

执行以下命令,过一段时间后会输出 Event queue overflow

$ fswatch -0 nohup.out | xargs -0 -I {} cp {} {}.`date +%Y%m%d%H%M%S`
Event queue overflow.
Status code: 1

解决方法 可以选择以下之一。

  1. 使用 poll_monitor monitor 而不是默认的 inotify_monitor

    fswatch -0 --monitor=poll_monitor nohup.out | xargs -0 -I {} cp {} {}.`date +%Y%m%d%H%M%S`
  2. 此限制是因为内核参数限制,主要参数 fs.inotify.max_queued_events [1]

    查看内核参数 fs.inotify.max_queued_events 的值,默认值为 16384

    $ sysctl fs.inotify.max_queued_events
    fs.inotify.max_queued_events = 16384

    修改默认值后,重新测试,结果正常

    $ sysctl fs.inotify.max_queued_events=1000000
    fs.inotify.max_queued_events = 1000000

    $ sysctl fs.inotify.max_queued_events
    fs.inotify.max_queued_events = 1000000

    永久修改此参数的值,可以将其写入内核配置文件 /etc/sysctl.conf

脚注

环境信息

  • Centos 7

lftp 安装

yum install -y lftp

常见用法

查看帮助信息

$ lftp -h
Usage: lftp [OPTS] <site>
`lftp' is the first command executed by lftp after rc files
-f <file> execute commands from the file and exit
-c <cmd> execute the commands and exit
--help print this help and exit
--version print lftp version and exit
Other options are the same as in `open' command
-e <cmd> execute the command just after selecting
-u <user>[,<pass>] use the user/password for authentication
-p <port> use the port for connection
<site> host name, URL or bookmark name

登陆 FTP

命令格式

lftp ${USER}:${PASSWORD}@${FTPIP}:${FTPPORT}

上传文件

在一条 shell 命令中执行登陆、上传、退出操作

lftp -u ${USER},${PASSWORD} -p ${FTPPORT} ${FTPIP} -e "put /1.mp4 && exit"

S3

s3 配置跨域

当使用 aws 的 cloudfront 或其他第三方 cdn (如 cdn77)为域名加速,资源是回源到 aws s3 的情况下,一般都需要配置 允许跨域,此种情况需要在 aws s3 存储桶中配置允许跨域 [1]

配置步骤如下:

  1. 定位到目标 s3 桶,进入 权限 管理页面

  2. 找到 CORS 配置,配置以下 JSON 格式内容,允许所有源的跨域

    [
    {
    "AllowedHeaders": [
    "*"
    ],
    "AllowedMethods": [
    "POST",
    "GET"
    ],
    "AllowedOrigins": [
    "*"
    ],
    "ExposeHeaders": []
    }
    ]

  3. Cloudfront 中,回源到此 S3 的加速域名配置中,行为 按照下图配置,主要为开启 OPTIONS 缓存,并在响应标头策略中选择: CORS-with-preflight-and-SecurityHeadersPolicy [2]

    此配置为可选配置,可以解决客户端偶尔会遇到的因跨域问题而导致的资源获取失败问题。

    阅读全文 »

Python SDK

Python SDK 官网使用说明

安装

pip install tencentcloud-sdk-python-intl-en

预热功能

参考文档

import json
from tencentcloud.common import credential
from tencentcloud.common.profile.client_profile import ClientProfile
from tencentcloud.common.profile.http_profile import HttpProfile
from tencentcloud.common.exception.tencent_cloud_sdk_exception import TencentCloudSDKException
from tencentcloud.vod.v20180717 import vod_client, models
try:
# 实例化一个认证对象,入参需要传入腾讯云账户 SecretId 和 SecretKey,此处还需注意密钥对的保密
# 代码泄露可能会导致 SecretId 和 SecretKey 泄露,并威胁账号下所有资源的安全性。密钥可前往官网控制台 https://console.tencentcloud.com/capi 进行获取
cred = credential.Credential("SecretId", "SecretKey")
# 实例化一个http选项,可选的,没有特殊需求可以跳过
httpProfile = HttpProfile()
httpProfile.endpoint = "vod.tencentcloudapi.com"

# 实例化一个client选项,可选的,没有特殊需求可以跳过
clientProfile = ClientProfile()
clientProfile.httpProfile = httpProfile
# 实例化要请求产品的client对象,clientProfile是可选的
client = vod_client.VodClient(cred, "", clientProfile)

# 实例化一个请求对象,每个接口都会对应一个request对象
req = models.PushUrlCacheRequest()
params = {
"Urls": [ "https://test.domain.com/z44R8F4D.ts", "https://test.domain.com/z70TBUet.ts", "https://test.domain.com/zB2OEC1t.ts",
"https://test.domain.com/zZw91TCL.ts", "https://test.domain.com/zbJ9U6Su.ts", "https://test.domain.com/zbvqkOMN.ts"]
}
req.from_json_string(json.dumps(params))

# 返回的resp是一个PushUrlCacheResponse的实例,与请求对象对应
resp = client.PushUrlCache(req)
# 输出json格式的字符串回包
print(resp.to_json_string())

except TencentCloudSDKException as err:
print(err)

脚注

环境信息

  • Centos 7
  • Kubernetes 1.24

Kubernetes Metrics Server

Kubernetes Metrics Server 从 kubelet 收集资源使用指标(情况)并通过 Metrics API 将其暴露给 Kubernetes API Server,以供 HPA(Horizontal Pod Autoscaler) 和 VPA(Vertical Pod Autoscaler) 使用。kubectl top 也使用 Metrics API。[1]

安装 Kubernetes Metrics Server

Kubernetes Metrics Server 安装之前必须要开启 kube api-server 的聚合层功能以及认证鉴权功能 [3]

检查 Kubernetes API Server 是否启用了聚合层功能及认证鉴权功能

$ ps -ef | grep apiserver | grep -E "authorization-mode|enable-aggregator-routing"
root 390 369 7 13:55 ? 00:00:37 kube-apiserver --advertise-address=172.31.26.116 \
--allow-privileged=true \
--authorization-mode=Node,RBAC \
--client-ca-file=/etc/kubernetes/pki/ca.crt \
--enable-admission-plugins=NodeRestriction \
--enable-bootstrap-token-auth=true \
--etcd-cafile=/etc/kubernetes/pki/etcd/ca.crt \
--etcd-certfile=/etc/kubernetes/pki/apiserver-etcd-client.crt \
--etcd-keyfile=/etc/kubernetes/pki/apiserver-etcd-client.key \
--etcd-servers=https://127.0.0.1:2379 \
--kubelet-client-certificate=/etc/kubernetes/pki/apiserver-kubelet-client.crt --kubelet-client-key=/etc/kubernetes/pki/apiserver-kubelet-client.key \
--kubelet-preferred-address-types=InternalIP,ExternalIP,Hostname \
--proxy-client-cert-file=/etc/kubernetes/pki/front-proxy-client.crt \
--proxy-client-key-file=/etc/kubernetes/pki/front-proxy-client.key \
--requestheader-allowed-names=front-proxy-client \
--requestheader-client-ca-file=/etc/kubernetes/pki/front-proxy-ca.crt \
--requestheader-extra-headers-prefix=X-Remote-Extra- \
--requestheader-group-headers=X-Remote-Group \
--requestheader-username-headers=X-Remote-User \
--secure-port=6443 --service-account-issuer=https://kubernetes.default.svc.cluster.local \
--service-account-key-file=/etc/kubernetes/pki/sa.pub \
--service-account-signing-key-file=/etc/kubernetes/pki/sa.key \
--service-cluster-ip-range=10.96.0.0/12 \
--tls-cert-file=/etc/kubernetes/pki/apiserver.crt --tls-private-key-file=/etc/kubernetes/pki/apiserver.key \
--enable-aggregator-routing=true

输出中包含了 --authorization-mode=Node,RBAC--enable-aggregator-routing=true,表示已开启对应功能。如若未开启,修改 api-server 的 manifest 文件 /etc/kubernetes/manifests/kube-apiserver.yaml,在 kube-apiserver 的启动参数中添加 --enable-aggregator-routing=true--authorization-mode=Node,RBAC

以下命令使用 yaml 文件安装最新版本 Metrics Server [2]

kubectl apply -f https://github.com/kubernetes-sigs/metrics-server/releases/latest/download/components.yaml

Kubernetes Metrics Server 部署配置常见错误

Failed to scrape node

参考部署步骤 部署后,Metrics Server 的 Pod 一直处于未就绪状态

$ kubectl get pods -A | grep metrics
kube-system metrics-server-5cdf47479d-rwtd6 0/1 Running 0 5m53s

检查 Pod 日志

$ kubectl logs -n kube-system metrics-server-5cdf47479d-rwtd6
1 scraper.go:140] "Failed to scrape node" err="Get \"https://172.31.21.3:10250/metrics/resource\": x509: cannot validate certificate for 172.31.21.3 because it doesn't contain any IP SANs" node="k8smaster3"
1 scraper.go:140] "Failed to scrape node" err="Get \"https://172.31.26.116:10250/metrics/resource\": x509: cannot validate certificate for 172.31.26.116 because it doesn't contain any IP SANs" node="k8smaster1"
1 scraper.go:140] "Failed to scrape node" err="Get \"https://172.31.19.164:10250/metrics/resource\": x509: cannot validate certificate for 172.31.19.164 because it doesn't contain any IP SANs" node="k8smaster2"

根据日志提示,由于 metrics-server 未获得TLS Bootstrap 签发证书的导致访问各节点资源时报错。

  1. 参考解决办法
  2. 添加选项 --kubelet-insecure-tls 不验证 Kubelet 的 CA 证书
    spec:
    containers:
    - args:
    - --cert-dir=/tmp
    - --secure-port=4443
    - --kubelet-preferred-address-types=InternalIP
    - --kubelet-use-node-status-port
    - --metric-resolution=15s
    - --kubelet-insecure-tls

no such host

参考部署步骤 部署后,Metrics Server 的 Pod 一直处于未就绪状态,检查 Pod 日志

$ kubectl logs -n kube-system metrics-server-5cdf47479d-rwtd6
"Failed to scrape node" err="Get \"https://k8smaster1:10250/metrics/resource\": dial tcp: lookup k8smaster1 on 10.96.0.10:53: no such host" node="k8smaster1"
"Failed probe" probe="metric-storage-ready" err="no metrics to serve"
"Failed to scrape node" err="Get \"https://k8smaster1:10250/metrics/resource\": dial tcp: lookup k8smaster1 on 10.96.0.10:53: no such host" node="k8smaster1"
"Failed to scrape node" err="Get \"https://k8smaster3:10250/metrics/resource\": dial tcp: lookup k8smaster3 on 10.96.0.10:53: no such host" node="k8smaster3"
"Failed to scrape node" err="Get \"https://k8sworker1:10250/metrics/resource\": dial tcp: lookup k8sworker1 on 10.96.0.10:53: no such host" node="k8sworker1"
"Failed to scrape node" err="Get \"https://k8sworker2:10250/metrics/resource\": dial tcp: lookup k8sworker2 on 10.96.0.10:53: no such host" node="k8sworker2"
"Failed to scrape node" err="Get \"https://k8smaster2:10250/metrics/resource\": dial tcp: lookup k8smaster2 on 10.96.0.10:53: no such host" node="k8smaster2"
"Failed probe" probe="metric-storage-ready" err="no metrics to serve"
I0524 09:32:43.033797 1 server.go:187] "Failed probe" probe="metric-storage-ready" err="no metrics to serve"

根据日志显示,API Server 的主机名解析存在问题。这是因为节点主机名在集群的 DNS 中无法解析导致,可以通过在 Metrics Server 的 Pod 中手动添加解析解决

metadata:
labels:
k8s-app: metrics-server
spec:
hostAliases:
- ip: '172.31.26.116'
hostnames:
- 'fm-k8s-c1-master1'
- ip: '172.31.19.164'
hostnames:
- 'fm-k8s-c1-master2'
- ip: '172.31.21.3'
hostnames:
- 'fm-k8s-c1-master3'
- ip: '172.31.16.124'
hostnames:
- 'fm-k8s-c1-worker1'
- ip: '172.31.22.159'
hostnames:
- 'fm-k8s-c1-worker2'
containers:
- args:
- --cert-dir=/tmp
- --secure-port=4443
- --kubelet-preferred-address-types=Hostname
- --kubelet-use-node-status-port
- --metric-resolution=15s
image: registry.k8s.io/metrics-server/metrics-server:v0.6.3

Metrics Server 无法获取所在节点的主机的监控信息

Metrics Server 部署成功后,无法获取所在节点的主机的监控信息,获取其他主机的监控信息正常,具体信息如下

$ kubectl get nodes -o wide
NAME STATUS ROLES AGE VERSION INTERNAL-IP EXTERNAL-IP OS-IMAGE KERNEL-VERSION CONTAINER-RUNTIME
k8s-master1 Ready control-plane 169d v1.24.7 172.31.26.116 <none> CentOS Linux 7 (Core) 5.4.225-1.el7.elrepo.x86_64 docker://20.10.9
k8s-master2 Ready control-plane 169d v1.24.7 172.31.19.164 <none> CentOS Linux 7 (Core) 5.4.225-1.el7.elrepo.x86_64 docker://20.10.9
k8s-master3 Ready control-plane 169d v1.24.7 172.31.21.3 <none> CentOS Linux 7 (Core) 5.4.225-1.el7.elrepo.x86_64 docker://20.10.9
k8s-worker1 Ready <none> 169d v1.24.7 172.31.16.124 <none> CentOS Linux 7 (Core) 5.4.225-1.el7.elrepo.x86_64 docker://20.10.9
k8s-worker2 Ready <none> 169d v1.24.7 172.31.22.159 <none> CentOS Linux 7 (Core) 3.10.0-1160.80.1.el7.x86_64 docker://20.10.9

$ kubectl get pods -A | grep met
metrics-server-c48655c66-jxwpt 1/1 Running 0 12m 10.244.4.138 k8s-worker1 <none> <none>

$ kubectl top node
NAME CPU(cores) CPU% MEMORY(bytes) MEMORY%
k8s-master1 381m 9% 3263Mi 43%
k8s-master2 149m 3% 3432Mi 45%
k8s-master3 166m 4% 3163Mi 41%
k8s-worker2 2093m 13% 21933Mi 71%
k8s-worker1 <unknown> <unknown> <unknown> <unknown>

查看 Metrics Server Pod 日志,显示

$ kubectl logs -n kube-system metrics-server-c48655c66-jxwpt
E0525 05:19:42.085468 1 scraper.go:140] "Failed to scrape node" err="Get \"https://172.31.16.124:10250/metrics/resource\": dial tcp 172.31.16.124:10250: connect: no route to host" node="fm-k8s-c1-worker1"
E0525 05:19:57.125457 1 scraper.go:140] "Failed to scrape node" err="Get \"https://172.31.16.124:10250/metrics/resource\": dial tcp 172.31.16.124:10250: connect: no route to host" node="fm-k8s-c1-worker1"
E0525 05:20:12.101468 1 scraper.go:140] "Failed to scrape node" err="Get \"https://172.31.16.124:10250/metrics/resource\": dial tcp 172.31.16.124:10250: connect: no route to host" node="fm-k8s-c1-worker1"
E0525 05:20:27.077495 1 scraper.go:140] "Failed to scrape node" err="Get \"https://172.31.16.124:10250/metrics/resource\": dial tcp 172.31.16.124:10250: connect: no route to host" node="fm-k8s-c1-worker1"

根据日志显示,是因为无法连接节点的 kubelet (端口 10250) 导致。为了定位问题,修改 Metrics Server 的部署 Yaml 文件,在其中加入一个容器,来方便使用工具测试问题。参考以下内容,在 Pod 中加入容器 centos:centos7.9.2009

metrics-server.yaml
apiVersion: apps/v1
kind: Deployment
metadata:
labels:
k8s-app: metrics-server
name: metrics-server
namespace: kube-system
spec:
selector:
matchLabels:
k8s-app: metrics-server
strategy:
rollingUpdate:
maxUnavailable: 0
template:
metadata:
labels:
k8s-app: metrics-server
spec:
containers:
- image: centos:centos7.9.2009
command:
- ping
- 127.0.0.1
name: centos7
- args:
- --cert-dir=/tmp
- --secure-port=4443
- --kubelet-preferred-address-types=InternalIP,ExternalIP,Hostname
- --kubelet-use-node-status-port
- --metric-resolution=15s
- --kubelet-insecure-tls
image: registry.k8s.io/metrics-server/metrics-server:v0.6.3
imagePullPolicy: IfNotPresent
...

重新部署后,登陆容器 centos7,安装所需工具进行测试。根据日志信息,首先测试 Pod 是否能连接到节点的 kubelet

$ curl -v 172.31.16.124:10250
* About to connect() to 172.31.16.124 port 10250 (#0)
* Trying 172.31.16.124...
* No route to host
* Failed connect to 172.31.16.124:10250; No route to host
* Closing connection 0
curl: (7) Failed connect to 172.31.16.124:10250; No route to host

$ curl -v 172.31.22.159:10250
* About to connect() to 172.31.22.159 port 10250 (#0)
* Trying 172.31.22.159...
* Connected to 172.31.22.159 (172.31.22.159) port 10250 (#0)
> GET / HTTP/1.1
> User-Agent: curl/7.29.0
> Host: 172.31.22.159:10250
> Accept: */*
>
* HTTP 1.0, assume close after body
< HTTP/1.0 400 Bad Request
<
Client sent an HTTP request to an HTTPS server.
* Closing connection 0

根据以上测试,Metrics Server 的 Pod 无法连接所在节点 k8s-worker1(172.31.16.124)的 kubelet (172.31.16.124:10250),可以正常连接其他节点的 kubelet。由此可以确定问题原因。

考虑到 Metrics Server 的 Pod 只是访问不到宿主节点所在的 kubelet,可以访问其他节点的 kubelet,梳理其中的网络连同流程发现,在访问其他节点的 kubelet 时,Metrics Server Pod 的报文在流出宿主节点前,会被 SNAT 为宿主节点的出口 IP,报文源 IP 为 宿主节点的 IP。而访问宿主节点的 kubelet 的报文,其源 IP 为 Metrics Server Pod 的 IP,目的 IP 为宿主节点的 IP。怀疑可能因为集群节点上的 iptables 允许集群节点的 IP 访问 kubelet,而 Pod 的 IP 未被允许访问 kubelet。为验证此猜想,在节点 k8s-worker1 的 iptables 添加允许 Metrics Server Pod 的 IP 访问的规则进行测试

iptables -I INPUT 7 -s 10.244.4.138 -j ACCEPT

再次测试和 kubelet 的连通性,发现可以正常连通,再次检查 kubectl top node,可以查到所有节点的监控数据

$ curl -v 172.31.16.124:10250
* About to connect() to 172.31.16.124 port 10250 (#0)
* Trying 172.31.16.124...
* Connected to 172.31.16.124 (172.31.16.124) port 10250 (#0)
> GET / HTTP/1.1
> User-Agent: curl/7.29.0
> Host: 172.31.16.124:10250
> Accept: */*
>
* HTTP 1.0, assume close after body
< HTTP/1.0 400 Bad Request
<
Client sent an HTTP request to an HTTPS server.
* Closing connection 0

$ kubectl top node
NAME CPU(cores) CPU% MEMORY(bytes) MEMORY%
fm-k8s-c1-master1 286m 7% 3242Mi 42%
fm-k8s-c1-master2 150m 3% 3262Mi 43%
fm-k8s-c1-master3 251m 6% 3247Mi 42%
fm-k8s-c1-worker1 166m 1% 4317Mi 13%
fm-k8s-c1-worker2 2013m 12% 21684Mi 70%

脚注

环境信息

  • Centos 7
  • Kubernetes 1.24

污点和容忍度

默认情况下,集群中的 master 节点被设置成了污点,以确保只有控制平面的 Pod 才能调度部署到主节点上。

显示节点的污点信息

$ kubectl describe node k8s-master1
Name: k8s-master1
Roles: control-plane
Labels: beta.kubernetes.io/arch=amd64
beta.kubernetes.io/os=linux
kubernetes.io/arch=amd64
kubernetes.io/hostname=k8s-master1
kubernetes.io/os=linux
node-role.kubernetes.io/control-plane=
node.kubernetes.io/exclude-from-external-load-balancers=
Annotations: flannel.alpha.coreos.com/backend-data: {"VNI":1,"VtepMAC":"de:75:a4:67:58:1f"}
flannel.alpha.coreos.com/backend-type: vxlan
flannel.alpha.coreos.com/kube-subnet-manager: true
flannel.alpha.coreos.com/public-ip: 172.31.26.116
kubeadm.alpha.kubernetes.io/cri-socket: unix:///var/run/cri-dockerd.sock
management.cattle.io/pod-limits: {"cpu":"100m","memory":"390Mi"}
management.cattle.io/pod-requests: {"cpu":"950m","memory":"290Mi","pods":"8"}
node.alpha.kubernetes.io/ttl: 0
volumes.kubernetes.io/controller-managed-attach-detach: true
CreationTimestamp: Tue, 06 Dec 2022 17:50:49 +0800
Taints: node-role.kubernetes.io/control-plane:NoSchedule
node-role.kubernetes.io/master:NoSchedule

Master 节点包含 2 个污点

  • node-role.kubernetes.io/control-plane:NoSchedule
  • node-role.kubernetes.io/master:NoSchedule

这 2 个污点将阻止 Pod 调度到这个节点上面,除非有 Pod 能够容忍这个污点(Taints),通常能容忍这个污点的都是控制平面的 Pod。

查看 Pod 的容忍度

$ kubectl describe pod -n kube-system kube-proxy-2cslw
...
Tolerations: op=Exists
node.kubernetes.io/disk-pressure:NoSchedule op=Exists
node.kubernetes.io/memory-pressure:NoSchedule op=Exists
node.kubernetes.io/network-unavailable:NoSchedule op=Exists
node.kubernetes.io/not-ready:NoExecute op=Exists
node.kubernetes.io/pid-pressure:NoSchedule op=Exists
node.kubernetes.io/unreachable:NoExecute op=Exists
node.kubernetes.io/unschedulable:NoSchedule op=Exists
Events: <none>

cmd 工具

ossutil 工具

阿里云云存储 OSS 相关工具汇总

ossutil 概述、安装、配置、常用命令

列出 oss 中的所有对象

命令格式 [1]

./ossutil64 ls oss://bucketname[/prefix] [-s] [-d] [--limited-num] [--marker] [--include] [--exclude]  [--version-id-marker] [--all-versions]

查看桶中资源总数及总的存储大小

$ ossutil64 du oss://test-bucket
object count:417000 object sum size:73556695567

CDN 加速域名配置缓存共享

CDN 加速域名配置缓存共享参考文档

CDN 加速域名配置缓存共享验证方法

比如 A 域名使用 B 域名的共享缓存,测试的时候先访问一条 B 域名中的新资源,使用 B 域名查看对应的缓存状态响应头,第一次访问应该是 X-Cache: MISS,重新访问一次,应该变成 X-Cache: HIT。接下来使用 A 域名访问,如果首次访问结果即为 HIT,说明共享缓存配置成功

$ curl -v -I B/test.png
> User-Agent: curl/7.29.0
> Host: B
> Accept: */*
>
< HTTP/1.1 200 OK
HTTP/1.1 200 OK
< Server: Tengine
Server: Tengine
< Content-Type: binary/octet-stream
Content-Type: binary/octet-stream
...
< X-Cache: MISS TCP_MISS dirn:-2:-2
X-Cache: MISS TCP_MISS dirn:-2:-2


$ curl -v -I B/test.png
> User-Agent: curl/7.29.0
> Host: B
> Accept: */*
>
< HTTP/1.1 200 OK
HTTP/1.1 200 OK
< Server: Tengine
Server: Tengine
< Content-Type: binary/octet-stream
Content-Type: binary/octet-stream
...
< X-Cache: HIT TCP_MISS dirn:-2:-2
X-Cache: HIT TCP_MISS dirn:-2:-2


$ curl -v -I A/test.png
> User-Agent: curl/7.29.0
> Host: B
> Accept: */*
>
< HTTP/1.1 200 OK
HTTP/1.1 200 OK
< Server: Tengine
Server: Tengine
< Content-Type: binary/octet-stream
Content-Type: binary/octet-stream
...
< X-Cache: HIT TCP_MISS dirn:-2:-2
X-Cache: HIT TCP_MISS dirn:-2:-2
阅读全文 »

Pod 是由一个或多个容器构成的集合,被 Kubernetes 作为一个整体进行部署和调度,是 Kubernetes 调度的最小单元。同一个 Pod 内的容器共享 network namespaceUTS nanespace

环境信息

  • Centos7
  • Kubernetes v1.24.7

Pod 创建过程

当用户在 Kubernetes 中创建了一个 Pod 后,CRI 和 CNI 协同创建 Pod 所属容器,并为 Pod 中的容器初始化网络协议栈的具体过程如下

  1. 用户在 Kubernetes 中创建了一个 Pod 后,Kubelet 接收到创建新 Pod 的任务,首先调用 CRI 创建 Pod 内的容器

  2. Pod 中第一个被创建的容器是 pause 容器。pause 容器中运行着一个功能非常简单的 C 程序,具体逻辑是把自己永远阻塞,没有实际的业务逻辑,主要功能是用来占用一个 network namespace

    创建 pause 容器,使用 docker none 网络模式,创建出来的容器除了 lo 回环网卡外没有其他网络设备。

  3. Pod 内的其他用户容器通过加入 pause 容器已占用的 network namespace 的方式共享同一个 network namespace。对应于 docker 的 Container 模式

    其他用户容器都使用 pause 容器的主机名,但并不使用同一个 UTS namespace。

  4. CNI 负责 Pod 中容器的网络初始化工作。主要为 Pod 内的 pause 容器添加 eth0 网卡、分配 IP、配置网关等。

pause 容器

pause 容器是 Pod 中被创建的第一个容器,Pod 中的其他容器通过使用 pause 容器的 network namespace 共享网络协议栈和主机名。它是 Pod 中其他容器的父容器。

1.8 以后版本默认不启用 PID namespace 共享。每个容器拥有独立的 PID namespace。

以下步骤通过 docker 演示 Pod 容器创建的整个过程。首先,创建 pause 容器

docker run --name=test-pause \
--hostname=test-pause \
--network=none \
--workdir=/ \
--log-opt max-size=100m \
--runtime=runc \
--detach=true \
k8s.gcr.io/pause:3.4.1

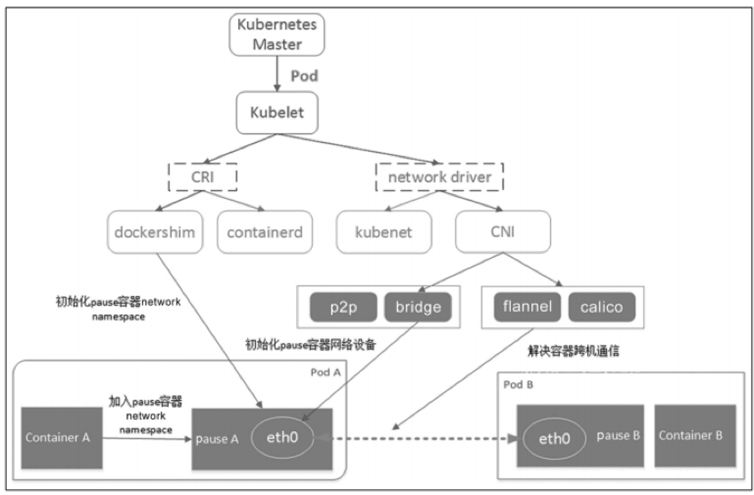
然后在 Pod 中运行其他容器,本示例启动 2 个应用容器,一个 nginx 容器,里面启动了 nginx 服务,一个自定义的容器,里面包含常用工具

$ docker run --name=pod_nginx_test \
--network=container:0eec8dd9d164 \
--restart=no --log-opt max-size=100m \
--runtime=runc --detach=true \
nginx

$ docker run --name=pod_centos_test \
--network=container:0eec8dd9d164 \
--restart=no --log-opt max-size=100m \
--runtime=runc --detach=true \
centos7:my ping 127.1

$ docker ps -a
CONTAINER ID IMAGE COMMAND CREATED STATUS PORTS NAMES
54d57add44d2 centos7:my "ping 127.1" 3 seconds ago Up 2 seconds pod_centos_test
cd0c661774e2 nginx "/docker-entrypoint.…" 2 minutes ago Up 2 minutes pod_nginx_test
0eec8dd9d164 k8s.gcr.io/pause:3.4.1 "/pause" 10 minutes ago Up 10 minutes test-pause

进入 pod_centos_test 容器,查看网络、端口、主机名信息

$ hostname
test-pause

$ s -elf
F S UID PID PPID C PRI NI ADDR SZ WCHAN STIME TTY TIME CMD
4 S root 1 0 0 80 0 - 6218 skb_wa 17:01 ? 00:00:00 ping 127.1
4 S root 7 0 0 80 0 - 2959 do_wai 17:02 pts/0 00:00:00 bash
0 R root 30 7 0 80 0 - 12935 - 17:08 pts/0 00:00:00 ps -elf

$ netstat -anutp
Active Internet connections (servers and established)
Proto Recv-Q Send-Q Local Address Foreign Address State PID/Program name
tcp 0 0 0.0.0.0:80 0.0.0.0:* LISTEN -
tcp6 0 0 :::80 :::* LISTEN -

$ ip add
1: lo: <LOOPBACK,UP,LOWER_UP> mtu 65536 qdisc noqueue state UNKNOWN group default qlen 1000
link/loopback 00:00:00:00:00:00 brd 00:00:00:00:00:00
inet 127.0.0.1/8 scope host lo
valid_lft forever preferred_lft forever

$ curl localhost:80
<!DOCTYPE html>
<html>
<head>
<title>Welcome to nginx!</title>
<style>
html { color-scheme: light dark; }
body { width: 35em; margin: 0 auto;
font-family: Tahoma, Verdana, Arial, sans-serif; }
</style>
</head>
<body>
<h1>Welcome to nginx!</h1>
<p>If you see this page, the nginx web server is successfully installed and
working. Further configuration is required.</p>

<p>For online documentation and support please refer to
<a href="http://nginx.org/">nginx.org</a>.<br/>
Commercial support is available at
<a href="http://nginx.com/">nginx.com</a>.</p>

<p><em>Thank you for using nginx.</em></p>
</body>
</html>
  • Pod 中的容器主机名相同,都使用 pause 容器的主机名,但实际并未共享 UTS namespace。

    可以通过找到对应 docker 容器的进程 PID,找到对应进程的 namespace 信息对比确认

    $ ps -elf | grep ping
    4 S root 35333 35311 0 80 0 - 6218 skb_wa 01:01 ? 00:00:00 ping 127.1

    $ ls -l /proc/35333/ns/
    total 0
    lrwxrwxrwx 1 root root 0 Apr 8 01:13 cgroup -> cgroup:[4026531835]
    lrwxrwxrwx 1 root root 0 Apr 8 01:02 ipc -> ipc:[4026532664]
    lrwxrwxrwx 1 root root 0 Apr 8 01:02 mnt -> mnt:[4026532662]
    lrwxrwxrwx 1 root root 0 Apr 8 01:02 net -> net:[4026532588]
    lrwxrwxrwx 1 root root 0 Apr 8 01:02 pid -> pid:[4026532665]
    lrwxrwxrwx 1 root root 0 Apr 8 01:13 pid_for_children -> pid:[4026532665]
    lrwxrwxrwx 1 root root 0 Apr 8 01:13 user -> user:[4026531837]
    lrwxrwxrwx 1 root root 0 Apr 8 01:02 uts -> uts:[4026532663]

    $ ps -elf | grep nginx
    4 S root 34909 34887 0 80 0 - 2233 sigsus 00:59 ? 00:00:00 nginx: master process nginx -g daemon off;

    $ ls -l /proc/34909/ns/
    total 0
    lrwxrwxrwx 1 root root 0 Apr 8 01:14 cgroup -> cgroup:[4026531835]
    lrwxrwxrwx 1 root root 0 Apr 8 01:00 ipc -> ipc:[4026532660]
    lrwxrwxrwx 1 root root 0 Apr 8 01:00 mnt -> mnt:[4026532658]
    lrwxrwxrwx 1 root root 0 Apr 8 01:00 net -> net:[4026532588]
    lrwxrwxrwx 1 root root 0 Apr 8 01:00 pid -> pid:[4026532661]
    lrwxrwxrwx 1 root root 0 Apr 8 01:14 pid_for_children -> pid:[4026532661]
    lrwxrwxrwx 1 root root 0 Apr 8 01:14 user -> user:[4026531837]
    lrwxrwxrwx 1 root root 0 Apr 8 01:00 uts -> uts:[4026532659]

    $ ps -elf | grep pause
    4 S root 34239 34221 0 80 0 - 241 ia32_s 00:51 ? 00:00:00 /pause

    $ ls -l /proc/34239/ns/
    total 0
    lrwxrwxrwx 1 root root 0 Apr 8 01:15 cgroup -> cgroup:[4026531835]
    lrwxrwxrwx 1 root root 0 Apr 8 00:51 ipc -> ipc:[4026532585]
    lrwxrwxrwx 1 root root 0 Apr 8 00:51 mnt -> mnt:[4026532583]
    lrwxrwxrwx 1 root root 0 Apr 8 00:51 net -> net:[4026532588]
    lrwxrwxrwx 1 root root 0 Apr 8 00:51 pid -> pid:[4026532586]
    lrwxrwxrwx 1 root root 0 Apr 8 01:15 pid_for_children -> pid:[4026532586]
    lrwxrwxrwx 1 root root 0 Apr 8 01:15 user -> user:[4026531837]
    lrwxrwxrwx 1 root root 0 Apr 8 00:51 uts -> uts:[4026532584]

    以上观察可以看到,Pod 中的容器共享了 network namespace,未共享 UTS namespace。Kubernetes 中 Pod 中的容器同理。

  • Pod 中容器的 PID namespace 进行了隔离,各个容器的 PID 进行了隔离,PID namespace 不同。
  • Pod 中的容器共享了 network namespace,具有相同的网络信息(网卡、IP、端口资源)
  • Pod 中的容器直接可以通过 localhost 互相访问
阅读全文 »

环境信息

  • Centos 7
  • Kubernetes 1.24

ServiceAccount

ServiceAccount 就像 Pod、Secret、ConfigMap 等一样,都是资源,属于 namespace 级别,作用在单独的命名空间。默认情况,每个 namespace 都有一个默认的 ServiceAccount。

$ kubectl get serviceaccount
NAME SECRETS AGE
default 0 160d

$ kubectl describe serviceaccount default
Name: default
Namespace: default
Labels: <none>
Annotations: <none>
Image pull secrets: <none>
Mountable secrets: <none>
Tokens: <none>
Events: <none>

namespace 中的每个 Pod 都和一个 ServiceAccount 关联,它代表了运行在 Pod 中的应用程序的身份证明。Pod 中的每个容器都会挂载此 ServiceAccount token

在 Pod 的 manifest 定义文件中,可以通过指定账户名称的方式将一个 ServiceAccount 关联到 Pod。如果不显示指定 ServiceAccount 的账户名称,Pod 会使用 namespace 中默认的 ServiceAccount。可以将不同的 ServiceAccount 关联给不同的 Pod 来控制每个 Pod 可以访问的资源。

当 API 服务接收到一个带有认证 token 的请求时, API 会用这个 token 来验证发送请求的客户端所关联的 ServiceAccount 是否允许执行请求的操作。

查看 ServiceAccount

以 rancher 相关的 ServiceAccount 为例,查看 ServiceAccount 信息

$ kubectl get serviceaccount -n cattle-system
NAME SECRETS AGE
default 0 160d
git-webhook-api-service 0 160d
rancher 0 160d
rancher-webhook 0 160d

$ kubectl describe sa default -n cattle-system
Name: default
Namespace: cattle-system
Labels: <none>
Annotations: <none>
Image pull secrets: <none>
Mountable secrets: <none>
Tokens: <none>
Events: <none>


以下输出名为 rancher 的 ServiceAccount 信息

$ kubectl describe sa rancher -n cattle-system
Name: rancher
Namespace: cattle-system
Labels: app=rancher
app.kubernetes.io/managed-by=Helm
chart=rancher-2.7.0
heritage=Helm
release=rancher
Annotations: meta.helm.sh/release-name: rancher
meta.helm.sh/release-namespace: cattle-system
Image pull secrets: <none>
Mountable secrets: <none>
Tokens: rancher-token
Events: <none>

ServiceAccount 主要包含了密钥(token)信息,客户端 (Pod)请求 API Service 时使用的 token 文件(如 /var/run/secrets/kubernetes.io/serviceaccount/token)持有 ServiceAccount 的 token 。

$ kubectl describe secret rancher-token -n cattle-system
Name: rancher-token
Namespace: cattle-system
Labels: <none>
Annotations: field.cattle.io/projectId: local:p-76mvn
kubernetes.io/service-account.name: rancher
kubernetes.io/service-account.uid: 1e80ce10-2ba3-4bc3-81d9-ccc72001431b

Type: kubernetes.io/service-account-token

Data
====
ca.crt: 1099 bytes
namespace: 13 bytes
token: eyJhbGciOiJSUzI1NiIsImtpZCI6Ik51eFpuNU9MUlp2Qkxm

通过 ServiceAccount 配置镜像拉取密钥

在新建了 ServiceAccount 之后,若要将它赋值给 Pod,通过在 Pod 定义中的 spec.serviceAccountName 字段上配置 ServiceAccount 名称来分配。Pod 的 ServiceAccount 必须在 Pod 创建时进行配置,后续不能被修改

RBAC

从 Kubernetes 1.8.0 开始,RBAC(基于角色的权限控制)授权插件升级为 GA(通用可用性),并在大多数集群上默认开启(比如通过 kubeadm 部署的集群)。RBAC 会阻止未授权的用户查看和修改集群状态,默认的 ServiceAccount 不允许查看集群状态

RBAC 授权规则是通过四种资源对象来进行配置的,他们可以分为 2 个组 [1]

  • RoleClusterRole - 一组代表相关权限的规则,他们指定了在资源上可以执行哪些操作(动词)
  • RoleBindingClusterRoleBinding - 将角色中定义的权限赋予一个或者一组用户。它包含若干主体(用户、组或者 ServiceAccount)的列表和对这些主体所获得的角色的引用。

RoleRoleBinding 属于 namespace 范围的资源,必须在 namespace 中配置

ClusterRoleClusterRoleBinding 是集群作用域的资源

一个 RoleBinding 可以引用某 ClusterRole 并将该 ClusterRole 绑定到 RoleBinding 所在的名字空间。但是,RoleBinding 不能授予主体集群级别的资源的访问权限,即使它引用了一个 ClusterRoleBinding


阅读全文 »

Godaddy API 参考文档

根据参考文档说明,获取到 keysecret

Python3 sdk 可以使用 godaddypy

环境信息

  • Python 3.11.2
  • godaddypy

godaddypy 主要提供了 2 个类,分别为

  • account - 使用 keysecretclient 生成鉴权头部
  • client - 连接 Godaddy API 并执行相应的请求

具体使用方法可以查看帮助信息,或者查看 Godaddy API 参考文档

>>> help(godaddypy)

godaddypy 常见用法示例

获取账号中的所有域名

>>> import godaddypy

>>> ak = 'AAAAAAAAAAAAAA'
>>> sk = 'BBBBBBBBBBBBBBB'

>>> account = godaddypy.Account(ak, sk)
>>> client = godaddypy.Client(account)

根据 Godaddy API 文档说明,获取域名,每次默认获取 500 个,最多可以一次性获取 1000 个。

# 获取域名,默认 100 个。如果账户内的域名数量少于 100,则一次性可以获取完毕,多于 100,获取前 100 个
>>> client.get_domains()

# 获取前 1000 个,最多一次性获取 1000 个。如果账户内的域名数量少于 1000,则一次性可以获取完毕,多于 1000,获取前 1000 个
>>> client.get_domains(limit=1000)

# 超过 1000 会报错
>>> client.get_domains(limit=1001)
Traceback (most recent call last):
File "/usr/local/lib/python3.11/site-packages/godaddypy/client.py", line 105, in _validate_response_success
response.raise_for_status()
File "/usr/local/lib/python3.11/site-packages/requests/models.py", line 1021, in raise_for_status
raise HTTPError(http_error_msg, response=self)
requests.exceptions.HTTPError: 422 Client Error: Unprocessable Entity for url: https://api.godaddy.com/v1/domains?limit=1001

During handling of the above exception, another exception occurred:

Traceback (most recent call last):
File "<stdin>", line 1, in <module>
File "/usr/local/lib/python3.11/site-packages/godaddypy/client.py", line 149, in get_domains
data = self._get_json_from_response(url, params=params)
^^^^^^^^^^^^^^^^^^^^^^^^^^^^^^^^^^^^^^^^^^^^^^^^
File "/usr/local/lib/python3.11/site-packages/godaddypy/client.py", line 75, in _get_json_from_response
return self._request_submit(requests.get, url=url, json=json, **kwargs).json()
^^^^^^^^^^^^^^^^^^^^^^^^^^^^^^^^^^^^^^^^^^^^^^^^^^^^^^^^^^^^^^^^
File "/usr/local/lib/python3.11/site-packages/godaddypy/client.py", line 97, in _request_submit
self._validate_response_success(resp)
File "/usr/local/lib/python3.11/site-packages/godaddypy/client.py", line 107, in _validate_response_success
raise BadResponse(response.json())
godaddypy.client.BadResponse: Response Data: {'code': 'VALUE_OVER', 'message': 'Limit must have a value no greater than 1000'}

阅读全文 »

常用 Volume 类型

以下是几种可用卷类型:

  • emptyDir - 用于存储临时数据的简单空目录,生命周期和 Pod 一致。
  • hostPath - 用于将宿主机中的文件系统挂载到 Pod 中,生命周期不与 Pod 绑定。
  • gitRepo - 通过拉取 Git 仓库的内容来初始化的卷。已弃用
  • nfs - 挂载到 Pod 中的 NFS 共享文件系统。
  • configMapsecret - 用于将 Kubernetes 中的部分资源和集群信息公开给 Pod 的特殊类型的卷
  • persistentVolumeClaim - 简称 PVC,使用预置和动态配置的持久卷。
  • downwardAPI - 在不使用 Kubernetes 客户端或 API 服务器的情况下获得自己或集群的信息 [5]

emptyDir 卷

emptyDir 表示与 Pod 生命周期相同的临时目录。[4]

emptyDir 配置示例

apiVersion: v1
kind: Pod
metadata:
name: test-pd
spec:
containers:
- image: registry.k8s.io/test-webserver
name: test-container
volumeMounts:
- mountPath: /cache
name: cache-volume
volumes:
- name: cache-volume
emptyDir:
sizeLimit: 500Mi
medium: Memory
  • emptyDir.medium - 表示此目录应使用哪种类别的存储介质,默认为 "",表示使用节点的默认介质(一般是节点的本地磁盘)。可选值必须为 "" 或者 MemoryMemory 表示使用 tmfs (存在内存而非硬盘)

PersistentVolume 和 PersistentVolumeClaim

PersistentVolume (PV)(持久化卷),是对底层的共享存储的一种抽象,PV 由管理员进行创建和配置,它和具体的底层的共享存储技术的实现方式有关,比如 CephGlusterFSNFS 等,都是通过插件机制完成与共享存储的对接。[1]

PersistentVolumeClaim(PVC)是由用户发起的对存储的请求。 它类似于 Pod。 Pod 消耗节点资源,PVC 消耗 PV 资源。Pod 可以请求特定级别的资源(CPU和内存)。PVC 可以请求特定的存储大小和访问模式(例如,可以一次读/写或多次只读)匹配的 PV。

PVCPV 中的 spec 关键字段要匹配,比如存储(storage)大小、读写模式,才能申请到对应的 PV 中的资源。PV 和 PVC 处于一一对应的关系。 [2]

PV 可以设置三种回收策略:

  • 保留(Retain) - 保留产生的数据,PV 不进行处理
  • 回收(Recycle) - 将执行清除操作,之后可以被新的pvc使用,需要插件支持。NFS 支持全部 3 种。
  • 删除(Delete) - 删除pv和外部关联的存储资源,需要插件支持。

PV卷阶段状态

  • Available – 资源尚未被 claim 使用
  • Bound – 卷已经被绑定到 claim 了
  • Released – claim 被删除,卷处于释放状态,但未被集群回收。
  • Failed – 卷自动回收失败
阅读全文 »

Kubernetes 的 Service 代表的是 Kubernetes 后端服务的入口,它主要包含服务的访问 IP(虚拟 IP)和端口,工作在 L4.

Service 只存储服务的入口信息(IP:PORT),不存储后端 Pod 信息,Service 是通过 Label Selector 选择与之匹配的后端 Pod。当被 Service 选择的后端 Pod 运行且能正常向外提供服务时,Kubernetes 的 Endpoint Controller 会生成一个新的 Endpoint 对象,指向此 Pod 的 IP:PORT。Service 接收到访问请求,会将请求转发到对应的 Endpoint。同时,Service 的访问 IP 和 Endpoint/Pod 的 IP 都会在 Kubernetes 的 DNS 服务里面进行注册以记录域名和 IP 的对应关系,因此用户可以在集群中通过域名的方式访问 Service 和 Pod。

用户创建 Service 后,Kubernetes 会从集群的可用服务 IP 池中为 Service 分配一个稳定的集群内访问 IP,称为 Cluster IP。Kubernetes 还会通过注册 DNS 条目为 Cluster IP 分配 域名(主机名)。Cluster IP域名 在集群内是独一无二的,并且在服务的整个生命周期中保持不变,直到将 Service 从集群中删除,Kubernetes 才会释放 Cluster IP域名 。通过此方法,Service 作为代理,向客户端提供了稳定不变的访问后端服务的入口。

Service 除了作为 代理 功能,同时也提供了 负载均衡高可用。当后端的 Pod 有多个时,默认会通过 轮询 将请求流量均匀分布到多个 Pod 上,当某个 Pod 不可用是,Service 不会将请求调度到问题节点。

Kubernetes 使用节点上运行的 kube-proxy 组件管理各 Service 和后端 Pod 的连接。kube-proxy 是一个基于出战流量的 负载均衡控制器,它监控 Kubernetes API Service 并持续将 Service IP (ClusterIP)映射到运行状况良好的后端 Pod,具体实现是通过主机上的 iptables/IPVS 的规则。访问 Service 的 IP 会被这些(路由)规则直接 DNAT 到后端 Pod 的 IP。

Service 配置语法参考

环境信息

  • Centos 7 3.10.0-1160
  • Kubernetes v1.24.7

kube-proxy iptables 模式下的规则解析

kube-proxy 默认使用 iptables 模式实现 Service 的代理转发和负载均衡。检查 kube-proxy 使用的代理模式

本示例使用相关信息如下

$ kubectl get services 
NAME TYPE CLUSTER-IP EXTERNAL-IP PORT(S) AGE
api-service ClusterIP 10.106.126.96 <none> 10302/TCP 145d

$ kubectl get endpoints api-service
NAME ENDPOINTS AGE
api-service 10.244.3.138:10302,10.244.4.120:10302 145d


针对 api-service,后端的 Pod 就绪后,生成了 ENDPOINTS,kube-proxy 会为该服务创建以下 iptables 规则

-A PREROUTING -m comment --comment "kubernetes service portals" -j KUBE-SERVICES

-A KUBE-SERVICES -d 10.106.126.96/32 -p tcp -m comment --comment "default/api-service:api-pord cluster IP" -m tcp --dport 10302 -j KUBE-SVC-DVTQLPR6DVOLBZS4

-A KUBE-SVC-DVTQLPR6DVOLBZS4 ! -s 10.244.0.0/16 -d 10.106.126.96/32 -p tcp -m comment --comment "default/api-service:api-pord cluster IP" -m tcp --dport 10302 -j KUBE-MARK-MASQ
-A KUBE-SVC-DVTQLPR6DVOLBZS4 -m comment --comment "default/api-service:api-pord -> 10.244.3.138:10302" -m statistic --mode random --probability 0.50000000000 -j KUBE-SEP-JXBL7O23XHVFQV2I
-A KUBE-SVC-DVTQLPR6DVOLBZS4 -m comment --comment "default/api-service:api-pord -> 10.244.4.120:10302" -j KUBE-SEP-BBPDSOPRICLINLPY

-A KUBE-SEP-JXBL7O23XHVFQV2I -s 10.244.3.138/32 -m comment --comment "default/api-service:api-pord" -j KUBE-MARK-MASQ
-A KUBE-SEP-JXBL7O23XHVFQV2I -p tcp -m comment --comment "default/api-service:api-pord" -m tcp -j DNAT --to-destination 10.244.3.138:10302

-A KUBE-SEP-BBPDSOPRICLINLPY -s 10.244.4.120/32 -m comment --comment "default/api-service:api-pord" -j KUBE-MARK-MASQ
-A KUBE-SEP-BBPDSOPRICLINLPY -p tcp -m comment --comment "default/api-service:api-pord" -m tcp -j DNAT --to-destination 10.244.4.120:10302

-A POSTROUTING -m comment --comment "flanneld masq" -j FLANNEL-POSTRTG
-A POSTROUTING -m comment --comment "kubernetes postrouting rules" -j KUBE-POSTROUTING-A FLANNEL-POSTRTG -m mark --mark 0x4000/0x4000 -m comment --comment "flanneld masq" -j RETURN
-A FLANNEL-POSTRTG -s 10.244.0.0/16 -d 10.244.0.0/16 -m comment --comment "flanneld masq" -j RETURN
-A FLANNEL-POSTRTG -s 10.244.0.0/16 ! -d 224.0.0.0/4 -m comment --comment "flanneld masq" -j MASQUERADE
-A FLANNEL-POSTRTG ! -s 10.244.0.0/16 -d 10.244.3.0/24 -m comment --comment "flanneld masq" -j RETURN
-A FLANNEL-POSTRTG ! -s 10.244.0.0/16 -d 10.244.0.0/16 -m comment --comment "flanneld masq" -j MASQUERADE

-A KUBE-POSTROUTING -m mark ! --mark 0x4000/0x4000 -j RETURN
-A KUBE-POSTROUTING -j MARK --set-xmark 0x4000/0x0
-A KUBE-POSTROUTING -m comment --comment "kubernetes service traffic requiring SNAT" -j MASQUERADE

具体工作流程如下:

  1. 所有进入 PREROUTING 链的流量会被跳转到 KUBE-SERVICES 自定义链
  2. 本示例中请求 api-service 的访问数据包(目的地址为 10.106.126.96:10302)在 PREROUTING 链中被 -d 10.106.126.96/32 -p tcp -m comment --comment "default/api-service:api-pord cluster IP" -m tcp --dport 10302 匹配到,根据规则跳转到自定义链 KUBE-SVC-DVTQLPR6DVOLBZS4
  3. 在自定义链 KUBE-SVC-DVTQLPR6DVOLBZS4 中,实现了负载均衡,一半的流量会被跳转到链 KUBE-SEP-JXBL7O23XHVFQV2I,另一半的流量会被跳转到 KUBE-SEP-BBPDSOPRICLINLPY
  4. 在自定义链 KUBE-SEP-JXBL7O23XHVFQV2IKUBE-SEP-BBPDSOPRICLINLPY 中,流量分别被 DNAT 分配到了后端的 Pod(就绪的 Endpoints)。
  5. Pod 处理完数据请求,向客户端返回请求结果时,在 POSTROUTING 链上要对数据包做 SNAT 处理,以确保客户端接收到的数据包的源地址是其发送请求时的目标地址。

通过以上 kube-proxy 管理的规则,Service 实现了对后端 Pod 的服务代理及负载均衡功能。

综上所述,iptables 模式最主要的链是 KUBE-SERVICESKUBE-SVC-*KUBE-SEP-*

  • KUBE-SERVICES - 访问集群服务的数据包入口,它会根据匹配到的目标 IP:PORT 将数据包分发到相应的链 KUBE-SVC-*
  • KUBE-SVC-* - 相当于一个负载均衡器,它会将数据包平均分配到 KUBE-SEP-* 链。每个 KUBE-SVC-* 链后面的 KUBE-SEP-* 链的数量和 Service 后端就绪的 Pod 数量一致。
  • KUBE-SEP-* - 通过 DNAT 将数据包的目的地址(IP:PORT)修改为后端就绪的 Pod 的 IP:PORT,从而将流量转发到相应的 Pod

kube-proxy 的 iptables 模式因为使用 DNAT 转发数据包,存在一定的性能损耗,另外,当集群中的 Service 数量上万时,节点上的 iptables rules 会非常庞大,对管理是个不小的负担,性能也会大打折扣。

环境信息

  • Centos 7 5.4.225-1
  • Kubernetes v1.24.7

Kubernetes DNS 服务的功能,是用来解析 Kubernetes 集群内的 Pod 和 Service 的域名,一般只供集群内部使用,不给外部使用。

默认情况下,Kubernetes DNS 应用部署后,会对外暴露一个 Service,集群内的容器通过访问该 Service 获得域名解析服务,这个 Service 的 ClusterIP 一般情况下都是固定的。

$ kubectl get services -n kube-system -o wide
NAME TYPE CLUSTER-IP EXTERNAL-IP PORT(S) AGE SELECTOR
kube-dns ClusterIP 10.96.0.10 <none> 53/UDP,53/TCP,9153/TCP 147d k8s-app=kube-dns

当 Kubernetes DNS 服务获得 ClusterIP 后,系统会给 Kubelet 配置启动参数指定 DNS Service 的 ClusterIP,DNS Service 的 IP 会在容器启动时传入,并写入容器系统的 DNS 配置中(一般为 /etc/resolv.conf 文件)

根据 kubelet 服务的启动命令,配置参数可以写在以下相关配置文件中

$ systemctl status kubelet -l
● kubelet.service - kubelet: The Kubernetes Node Agent
Loaded: loaded (/usr/lib/systemd/system/kubelet.service; enabled; vendor preset: disabled)
Drop-In: /usr/lib/systemd/system/kubelet.service.d
└─10-kubeadm.conf
Active: active (running) since Tue 2023-05-02 16:06:16 CST; 21h ago
Docs: https://kubernetes.io/docs/
Main PID: 1413 (kubelet)
Tasks: 29
Memory: 203.0M
CGroup: /system.slice/kubelet.service
└─1413 /usr/bin/kubelet --bootstrap-kubeconfig=/etc/kubernetes/bootstrap-kubelet.conf \
--kubeconfig=/etc/kubernetes/kubelet.conf \
--config=/var/lib/kubelet/config.yaml \
--container-runtime=remote \
--container-runtime-endpoint=unix:///var/run/cri-dockerd.sock \
--pod-infra-container-image=k8s.gcr.io/pause:3.7

$ ps aux | grep kubelet
/usr/bin/kubelet --bootstrap-kubeconfig=/etc/kubernetes/bootstrap-kubelet.conf 、
--kubeconfig=/etc/kubernetes/kubelet.conf \
--config=/var/lib/kubelet/config.yaml \
--container-runtime=remote \
--container-runtime-endpoint=unix:///var/run/cri-dockerd.sock \
--pod-infra-container-image=k8s.gcr.io/pause:3.7

DNS 的相关配置在文件 /var/lib/kubelet/config.yaml 中,主要选项为 clusterDNS

/var/lib/kubelet/config.yaml
apiVersion: kubelet.config.k8s.io/v1beta1
authentication:
anonymous:
enabled: false
webhook:
cacheTTL: 0s
enabled: true
x509:
clientCAFile: /etc/kubernetes/pki/ca.crt
authorization:
mode: Webhook
webhook:
cacheAuthorizedTTL: 0s
cacheUnauthorizedTTL: 0s
cgroupDriver: systemd
clusterDNS:
- 10.96.0.10
clusterDomain: cluster.local
cpuManagerReconcilePeriod: 0s
evictionPressureTransitionPeriod: 0s
fileCheckFrequency: 0s
healthzBindAddress: 127.0.0.1
healthzPort: 10248
httpCheckFrequency: 0s
imageMinimumGCAge: 0s
kind: KubeletConfiguration
logging:
flushFrequency: 0
options:
json:
infoBufferSize: "0"
verbosity: 0
memorySwap: {}
nodeStatusReportFrequency: 0s
nodeStatusUpdateFrequency: 0s
rotateCertificates: true
runtimeRequestTimeout: 0s
shutdownGracePeriod: 0s
shutdownGracePeriodCriticalPods: 0s
staticPodPath: /etc/kubernetes/manifests
streamingConnectionIdleTimeout: 0s
syncFrequency: 0s
volumeStatsAggPeriod: 0s
阅读全文 »

环境信息

  • Centos 7

VNC 是一个图形桌面共享系统,可以通过远程连接的方式连接到服务器的图形系统以控制操作系统
VNC 包括以下四个部分 : vncservervncviewervncpasswordvncconnect
VNC client 端通过 VNC 协议远程连接到 vnc server 端,进行桌面共享及交互;

安装 tigervnc

安装之前首先要确保系统已安装图形系统,本文以 GNOME Desktop 为图形桌面系统,执行以下命令检查是否已安装 GNOME Desktop,如果未安装,使用命令 yum groupinstall "GNOME Desktop" 安装

$ yum grouplist
Loaded plugins: fastestmirror, langpacks
Loading mirror speeds from cached hostfile
Installed Environment Groups:
GNOME Desktop
Available Environment Groups:
Minimal Install
Compute Node
...

桌面系统安装后,使用以下命令,安装 tigervnc

yum install -y tigervnc-server

可以参考 /lib/systemd/system/vncserver@.service 中的指示,生成服务配置文件:

cp /lib/systemd/system/vncserver@.service /etc/systemd/system/vncserver@:1.service
vim /etc/systemd/system/vncserver@\:1.service

修改以下行,将其中的 <USER> 改为要远程登录的用户名,例如 root

/etc/systemd/system/vncserver@\:1.service
ExecStart=/usr/bin/vncserver_wrapper root %i

如果有多个用户需要远程连接,可以重复以上步骤,建立多个配置文件,如 /etc/systemd/system/vncserver@:2.service,各个服务之间互不影响,关闭一个服务,不影响其他的 vnc 服务 (如关闭: vncserver@:2.servicevncserver@:1.servicevnc 远程依旧可以使用)

修改服务文件后,使用以下命令重新加载服务启动脚本:

systemctl daemon-reload

启动服务:

systemctl start vncserver@:1.service

服务启动后,会监听 5901 端口,如果有第二个服务,会监听在 5902 端口,以此类推,防火墙需要放通此端口

切换到需要 vnc 远程登录的用户,使用以下命令配置 vnc 远程登录用户的密码(只是 vnc 登录时使用的密码,非系统用户密码)

[root@localhost ~]# su - USER
[USER@localhost ~]$ vncpasswd

设置 vncpasswd 密码后,在账号的家目录里就会自动建立 .vnc 文件,其中包括对应用户的 vnc 相关的日志

配置完成后,下载客户端 进行远程登录

常见错误

getpassword error: Inappropriate ioctl for device

vncserver@:1.service 服务启动失败,端口未监听

$ netstat -anutp | grep LIST
tcp 0 0 0.0.0.0:111 0.0.0.0:* LISTEN 735/rpcbind
tcp6 0 0 :::30000 :::* LISTEN 1251/sshd
tcp6 0 0 :::80 :::* LISTEN 17064/nginx: master
tcp6 0 0 :::8181 :::* LISTEN 17064/nginx: master
tcp6 0 0 :::8443 :::* LISTEN 14032/nginx-ingress
tcp6 0 0 :::443 :::* LISTEN 17064/nginx: master
tcp6 0 0 :::10254 :::* LISTEN 14032/nginx-ingress
tcp6 0 0 :::111 :::* LISTEN 735/rpcbind

$ systemctl status vncserver@:1.service
● vncserver@:1.service - Remote desktop service (VNC)
Loaded: loaded (/etc/systemd/system/vncserver@:1.service; disabled; vendor preset: disabled)
Active: failed (Result: exit-code) since Tue 2023-05-02 13:29:44 CST; 14s ago
Process: 28040 ExecStart=/usr/bin/vncserver_wrapper root %i (code=exited, status=2)
Process: 28037 ExecStartPre=/bin/sh -c /usr/bin/vncserver -kill %i > /dev/null 2>&1 || : (code=exited, status=0/SUCCESS)
Main PID: 28040 (code=exited, status=2)

May 02 13:29:44 test systemd[1]: Starting Remote desktop service (VNC)...
May 02 13:29:44 test systemd[1]: Started Remote desktop service (VNC).
May 02 13:29:44 test vncserver_wrapper[28040]: You will require a password to access your desktops.
May 02 13:29:44 test vncserver_wrapper[28040]: getpassword error: Inappropriate ioctl for device
May 02 13:29:44 test vncserver_wrapper[28040]: Password:FATAL: 'runuser -l root' failed!
May 02 13:29:44 test systemd[1]: vncserver@:1.service: main process exited, code=exited, status=2/INVALIDARGUMENT
May 02 13:29:44 test systemd[1]: Unit vncserver@:1.service entered failed state.
May 02 13:29:44 test systemd[1]: vncserver@:1.service failed.

解决方法 配置登陆用的 VNC 密码,重启服务

su - root
vncpasswd

systemctl start vncserver@:1.service

环境信息

  • Vmware workstation 17

其他下载地址

激活密钥: NZ4RR-FTK5H-H81C1-Q30QH-1V2LA

Centos7 server 中安装使用 Vmware workstation

Centos 7 server版本(无图形界面)安装使用 Vmware workstation 参考链接

常见错误

VMware Workstation and Hyper-V are not compatible. Remove the Hyper-V role from the system before running VMware Workstation.

aws workspace 中不兼容 Vmware workstation

Failed to start SYSV: This service starts and stops VMware services.

参考 Centos7 server 中安装使用 Vmware workstation ,安装后,vmware 无法启动

$ /etc/rc.d/init.d/vmware start
Starting vmware (via systemctl): Job for vmware.service failed because the control process exited with error code. See "systemctl status vmware.service" and "journalctl -xe" for details.
[FAILED]

$ journalctl -xe -u vmware
--
-- Unit vmware.service has failed.
--
-- The result is failed.
May 02 11:13:39 k8s-uat-xhy-mysql-new systemd[1]: Unit vmware.service entered failed state.
May 02 11:13:39 k8s-uat-xhy-mysql-new systemd[1]: vmware.service failed.
May 02 11:19:37 k8s-uat-xhy-mysql-new systemd[1]: Starting SYSV: This service starts and stops VMware services...
-- Subject: Unit vmware.service has begun start-up
-- Defined-By: systemd
-- Support: http://lists.freedesktop.org/mailman/listinfo/systemd-devel
--
-- Unit vmware.service has begun starting up.
May 02 11:19:37 k8s-uat-xhy-mysql-new vmware[22226]: Starting VMware services:
May 02 11:19:37 k8s-uat-xhy-mysql-new vmware[22226]: Virtual machine monitor[FAILED]
May 02 11:19:37 k8s-uat-xhy-mysql-new vmware[22226]: Virtual machine communication interface[ OK ]
May 02 11:19:37 k8s-uat-xhy-mysql-new vmware[22226]: VM communication interface socket family[ OK ]
May 02 11:19:37 k8s-uat-xhy-mysql-new vmware[22226]: Virtual ethernet[FAILED]
May 02 11:19:37 k8s-uat-xhy-mysql-new vmware[22226]: VMware Authentication Daemon[ OK ]
May 02 11:19:37 k8s-uat-xhy-mysql-new systemd[1]: vmware.service: control process exited, code=exited status=1
May 02 11:19:37 k8s-uat-xhy-mysql-new systemd[1]: Failed to start SYSV: This service starts and stops VMware services.
-- Subject: Unit vmware.service has failed
-- Defined-By: systemd
-- Support: http://lists.freedesktop.org/mailman/listinfo/systemd-devel
--
-- Unit vmware.service has failed.
--
-- The result is failed.
May 02 11:19:37 k8s-uat-xhy-mysql-new systemd[1]: Unit vmware.service entered failed state.
May 02 11:19:37 k8s-uat-xhy-mysql-new systemd[1]: vmware.service failed.


执行以下命令 [1]

$ vmware-modconfig --console --install-status
[AppLoader] GLib does not have GSettings support.
vmmon: unknown
vmnet: unknown

查看内核版本

$ uname -r
3.10.0-1062.9.1.el7.x86_64

脚注

环境信息

  • Centos7 3.10.0-1160
  • Docker Engine - Community 23.0.3
  • kubernetes 1.21.2-0
  • kubernetes-cni-0.8.7-0

Kubernetes 对任何网络实现都规定了以下要求: [1]

  • 所有 Pod 都可以在不使用网络地址转换 (NAT) 的情况下与所有其他 Pod 通信。

    容器之间直接通信,不需要额外的 NAT,不存在源地址伪装的情况

  • 所有节点都可以在没有 NAT 的情况下与所有 Pod 通信。

    Node 与容器直接通信,不需要额外的 NAT

  • Pod 认为自己的 IP 与其他人认为的 IP 相同。

CNI

CNI 是 Kubernetes 容器网络的标准,CNI 是 Kubernetes 和底层网络插件之间的一个抽象层,为 Kubernetes 屏蔽了底层网络实现的负责度,同时解耦了 Kubernetes 和具体的网络插件实现。

安装 CNI

$ yum install kubernetes-cni

$ rpm -qa | grep kube
kubeadm-1.21.2-0.x86_64
kubectl-1.21.2-0.x86_64
kubelet-1.21.2-0.x86_64
kubernetes-cni-0.8.7-0.x86_64

$ rpm -ql kubernetes-cni-0.8.7-0
/opt/cni
/opt/cni/bin
/opt/cni/bin/bandwidth
/opt/cni/bin/bridge
/opt/cni/bin/dhcp
/opt/cni/bin/firewall
/opt/cni/bin/flannel
/opt/cni/bin/host-device
/opt/cni/bin/host-local
/opt/cni/bin/ipvlan
/opt/cni/bin/loopback
/opt/cni/bin/macvlan
/opt/cni/bin/portmap
/opt/cni/bin/ptp
/opt/cni/bin/sbr
/opt/cni/bin/static
/opt/cni/bin/tuning
/opt/cni/bin/vlan

Kubernetes 要使用 CNI,需要在 kubelet 启动时配置启动参数 --network-plugin=cni(默认配置,可使用 systemctl status kubelet -l 查看启动参数)。

kubelet 从 --cni-config-dir (默认为 /etc/cni/net.d/)中读取网络插件的配置文件,并使用该文件中的 CNI 配置来配置每个 Pod 网络。如果该目录 (/etc/cni/net.d/)中有多个配置文件,则使用文件名字典序列中的第一个文件。

CNI 插件的二进制文件放置的目录是通过 kubelet 的 --cni-bin-dir 参数指定,默认为 /opt/cni/bin/

阅读全文 »