环境信息
Centos 7
Prometheus 2.44.0
node_exporter-1.6.0
node_exporter 安装 安装 node_exporter 官方文档
以下步骤演示安装 node_exporter 并使用 systemd 管理服务
wget https://github.com/prometheus/node_exporter/releases/download/v1.6.0/node_exporter-1.6.0.linux-amd64.tar.gz

tar -xf node_exporter-1.6.0.linux-amd64.tar.gz

cp node_exporter-1.6.0.linux-amd64/node_exporter /usr/bin/
生成 systemd 服务配置文件 /usr/lib/systemd/system/node_exporter.service
/usr/lib/systemd/system/node_exporter.service [Unit] Description=node_exporter After=syslog.target After=network.target [Service] Type=simple ExecStart=/usr/bin/node_exporter Restart=always RestartSec=10 StartLimitInterval=100 [Install] WantedBy=multi-user.target
执行以下命令管理服务
$ systemctl daemon-reload

$ systemctl status node_exporter
● node_exporter.service - node_exporter
   Loaded: loaded (/usr/lib/systemd/system/node_exporter.service; disabled; vendor preset: disabled)
   Active: inactive (dead)

$ systemctl enable --now node_exporter
Created symlink from /etc/systemd/system/multi-user.target.wants/node_exporter.service to /usr/lib/systemd/system/node_exporter.service.

$ systemctl status node_exporter
● node_exporter.service - node_exporter
   Loaded: loaded (/usr/lib/systemd/system/node_exporter.service; enabled; vendor preset: disabled)
   Active: active (running) since Fri 2023-06-23 10:34:08 CST; 2s ago
 Main PID: 28578 (node_exporter)
   CGroup: /system.slice/node_exporter.service
           └─28578 /usr/bin/node_exporter
node_exporter 配置信息 启动参数详解
参数
说明
示例
--web.listen-address=":9100"node_exporter 监听端口,默认 9100
--web.telemetry-path="/metrics"prometheus 获取 Metrics 访问的 url,默认 /metrics
--log.level="info"日志级别
--log.format="logger:stderr"日志打印格式
--collector.disable-defaults关闭默认的采集项
--no-collector.${item}关闭某一项默认开启的采集项
--no-collector.cpu
--collector.systemd.unit-include="(docker'|'sshd).service"收集指定服务的指标
可以配置通过正则表达式屏蔽或者选择某些监控项 [1]
参数
说明
示例
--collector.diskstats.ignored-devices="^(ram'|'loop'|')\\d+$"忽略某些磁盘的信息收集
--collector.filesystem.ignored-mount-points="^/(dev'|'proc'|')($'|'/)"忽略某些文件系统挂载点的信息收集
--collector.filesystem.ignored-fs-types="^(autofs'|'proc)$"忽略某些文件系统类型的信息收集
--collector.netclass.ignored-devices="^$"忽略某些网络类的信息收集
--collector.netdev.ignored-devices="^$"忽略某些网络设备的信息收集
--collector.netstat.fields="^$"配置需要获取的网络状态信息
--collector.vmstat.fields="^(oom_kill'|'pgpg'|'pswp).*"配置 vmstat 返回信息中需要收集的选项
功能对照表 默认开启的功能 默认开启的功能 [1]
名称
说明
系统
arp从 /proc/net/arp 中收集 ARP 统计信息
Linux
conntrack从 /proc/sys/net/netfilter/ 中收集 conntrack 统计信息
Linux
cpu收集 cpu 统计信息
Darwin, Dragonfly, FreeBSD, Linux
diskstats从 /proc/diskstats 中收集磁盘 I/O 统计信息
Linux
edac错误检测与纠正统计信息
Linux
entropy可用内核熵信息
Linux
execexecution 统计信息
Dragonfly, FreeBSD
filefd从 /proc/sys/fs/file-nr 中收集文件描述符统计信息
Linux
filesystem文件系统统计信息,例如磁盘已使用空间
Darwin, Dragonfly, FreeBSD, Linux, OpenBSD
hwmon从 /sys/class/hwmon/ 中收集监控器或传感器数据信息
Linux
infiniband从 InfiniBand 配置中收集网络统计信息
Linux
loadavg收集系统负载信息
Darwin, Dragonfly, FreeBSD, Linux, NetBSD, OpenBSD, Solaris
mdadm从 /proc/mdstat 中获取设备统计信息
Linux
meminfo内存统计信息
Darwin, Dragonfly, FreeBSD, Linux
netdev网口流量统计信息,单位 bytes
Darwin, Dragonfly, FreeBSD, Linux, OpenBSD
netstat从 /proc/net/netstat 收集网络统计数据,等同于 netstat -s
Linux
sockstat从 /proc/net/sockstat 中收集 socket 统计信息
Linux
stat从 /proc/stat 中收集各种统计信息,包含系统启动时间,forks, 中断等
Linux
textfile通过 --collector.textfile.directory 参数指定本地文本收集路径,收集文本信息
any
time系统当前时间
any
uname通过 uname 系统调用, 获取系统信息
any
vmstat从 /proc/vmstat 中收集统计信息
Linux
wifi收集 wifi 设备相关统计数据
Linux
xfs收集 xfs 运行时统计信息
Linux (kernel 4.4+)
zfs收集 zfs 性能统计信息
Linux
默认关闭的功能 默认关闭的功能 [1]
名称
说明
系统
bonding收集系统配置以及激活的绑定网卡数量
Linux
buddyinfo从 /proc/buddyinfo 中收集内存碎片统计信息
Linux
devstat收集设备统计信息
Dragonfly, FreeBSD
drbd收集远程镜像块设备(DRBD)统计信息
Linux
interrupts收集更具体的中断统计信息
Linux,OpenBSD
ipvs从 /proc/net/ip_vs 中收集 IPVS 状态信息,从 /proc/net/ip_vs_stats 获取统计信息
Linux
ksmd从 /sys/kernel/mm/ksm 中获取内核和系统统计信息
Linux
logind从 logind 中收集会话统计信息
Linux
meminfo_numa从 /proc/meminfo_numa 中收集内存统计信息
Linux
mountstats从 /proc/self/mountstat 中收集文件系统统计信息,包括 NFS 客户端统计信息
Linux
nfs从 /proc/net/rpc/nfs 中收集 NFS 统计信息,等同于 nfsstat -c
Linux
qdisc收集队列推定统计信息
Linux
runit收集 runit 状态信息
any
supervisord收集 supervisord 状态信息
any
systemd从 systemd 中收集设备系统状态信息
Linux
tcpstat从 /proc/net/tcp 和 /proc/net/tcp6 收集 TCP 连接状态信息
Linux
配置示例 采集白名单配置 关闭默认的采集项,只开启指定的采集项(白名单)
node-exporter --collector.disable-defaults --collector.cpu --collector.meminfo
采集黑名单配置 关闭某一项默认开启的采集项
node-exporter --no-collector.cpu
配置 node_exporter 收集系统服务 修改 node_exporter 使用以下参数,本示例中使用 Kubernetes DaemonSet 启动。需要先配置参数 --collector.systemd,再填加服务白名单,否则无法使用 --collector.systemd.unit-whitelist 参数
containers:
- args:
  - --path.procfs
  - /host/proc
  - --path.sysfs
  - /host/sys
  - --collector.filesystem.ignored-mount-points
  - '"^/(sys|proc|dev|host|etc)($|/)"'
  - --collector.systemd
  - --collector.systemd.unit-include
  - '(sshd|docker|cri-docker|crond|iptables|systemd-journald).service'
  image: prom/node-exporter
  imagePullPolicy: Always
  name: node-exporter
  ports:
  - containerPort: 9100
    hostPort: 9100
    name: http
    protocol: TCP
  resources: {}
  securityContext:
    privileged: true
  terminationMessagePath: /dev/termination-log
  terminationMessagePolicy: File
  volumeMounts:
  - mountPath: /host/dev
    name: dev
  - mountPath: /host/proc
    name: proc
  - mountPath: /host/sys
    name: sys
  - mountPath: /rootfs
    name: rootfs
volumes:
- hostPath:
    path: /proc
    type: ""
  name: proc
- hostPath:
    path: /dev
    type: ""
  name: dev
- hostPath:
    path: /sys
    type: ""
  name: sys
- hostPath:
    path: /
    type: ""
  name: rootfs
node_exporter 启动后,在节点上检查 node_exporter 输出的 Metrics
$ curl localhost:9100/metrics | grep -i node_systemd
node_systemd_unit_state{name="cri-docker.service",state="activating",type="notify"} 0
node_systemd_unit_state{name="cri-docker.service",state="active",type="notify"} 1
node_systemd_unit_state{name="cri-docker.service",state="deactivating",type="notify"} 0
node_systemd_unit_state{name="cri-docker.service",state="failed",type="notify"} 0
node_systemd_unit_state{name="cri-docker.service",state="inactive",type="notify"} 0
node_systemd_unit_state{name="crond.service",state="activating",type="simple"} 0
node_systemd_unit_state{name="crond.service",state="active",type="simple"} 1
node_systemd_unit_state{name="crond.service",state="deactivating",type="simple"} 0
node_systemd_unit_state{name="crond.service",state="failed",type="simple"} 0
node_systemd_unit_state{name="crond.service",state="inactive",type="simple"} 0
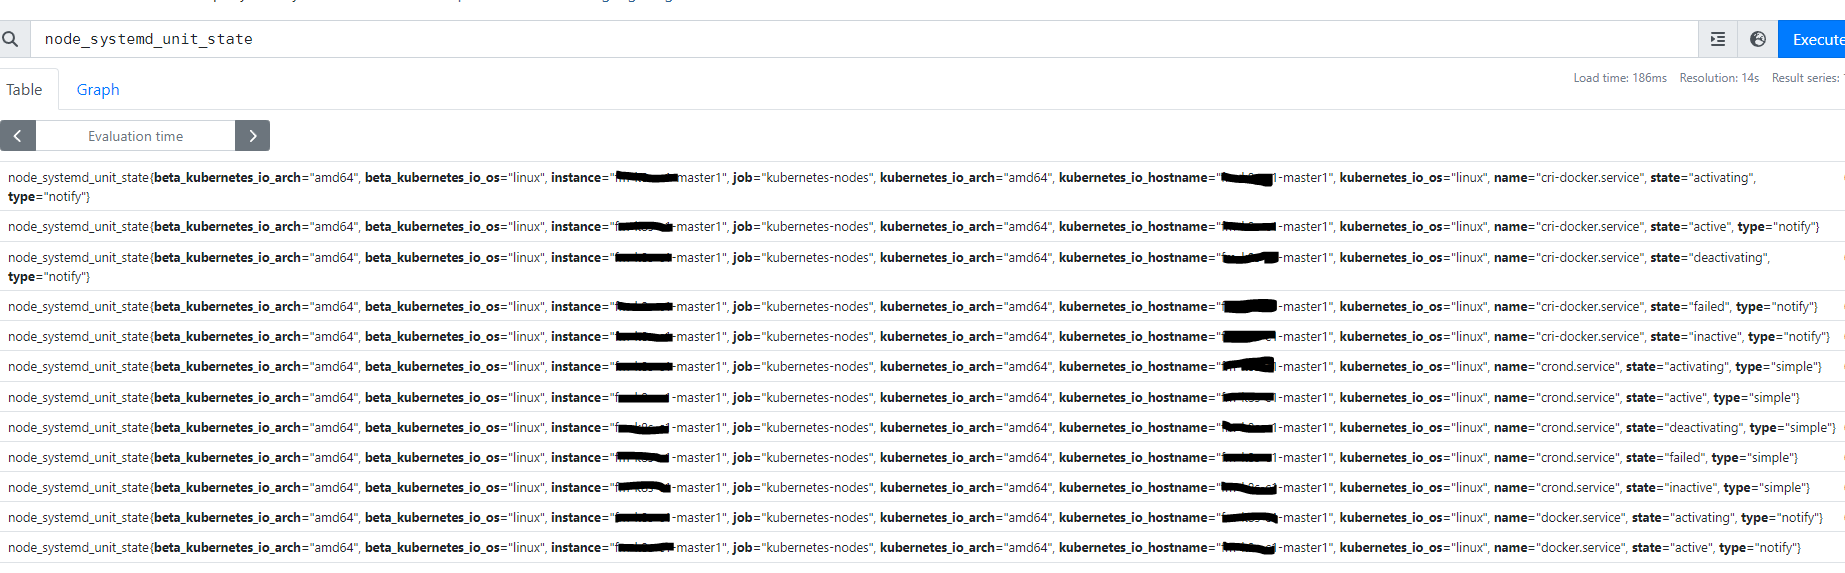
在 Prometheus 的 UI 界面中检查
使用 node_exporter 监听主机上的端口 node_exporter 不支持直接采集主机上的端口监听状态数据。但 node_exporter 支持从本地目录直接读取指标数据
为了实现此需求,可以写个定时脚本周期性的采集端口状态数据到本地文件中,然后配置 node_exporter 从本地文件中读取统计信息供给 Prometheus 抓取。
参考以下脚本监控指定端口的状态,并将状态数据写入指定的文件,此处为 /opt/prometheus/data/open_ports.prom
/opt/prometheus/monitor_open_ports.sh # !/bin/bash MONITOR_DADA_OUTPUT_FILE='/opt/prometheus/data/open_ports.prom' # Define the ports to monitor. Add or remove ports as needed. MONITORED_PORTS=(7380 7381 7382 17380 17381 17382) # Function to extract open ports from netstat output get_open_ports() { for port in "${MONITORED_PORTS[@]}"; do open_port_count=$(netstat -an | grep -c -E ":${port}.*LISTEN") if [[ $open_port_count -gt 0 ]]; then echo "node_exporter_open_ports{port=\"$port\"} $open_port_count" >> $MONITOR_DADA_OUTPUT_FILE else echo "node_exporter_open_ports{port=\"$port\"} 0" >> $MONITOR_DADA_OUTPUT_FILE fi done } # Define Metrics Type and clear OLD DATA. echo "# TYPE node_exporter_open_ports gauge" > $MONITOR_DADA_OUTPUT_FILE get_open_ports
# TYPE node_exporter_open_ports gauge 指定 Prometheus 数据类型为 gauge。同一个指标类型只能定义一次 # TYPE node_exporter_open_ports gauge 定义,node_exporter 不会抓取指标而是输出错误:msg="failed to collect textfile data" file=open_ports.prom err="failed to parse textfile data from \"/opt/prometheus/data/open_ports.prom\": text format parsing error in line 3: second TYPE line for metric name \"node_exporter_open_ports\", or TYPE reported after samples"
配置 node_exporter 抓取本地目录 /opt/prometheus/data/ 中的统计数据,主要是使用 textfile 这个 Collector。
ExecStart=/usr/bin/node_exporter --collector.textfile.directory=/opt/prometheus/data/
启动 node_exporter 后,检查 node_exporter 采集的统计数据:
# curl localhost:9100/metrics | grep port
node_exporter_open_ports{port="17380"} 1
node_exporter_open_ports{port="17381"} 1
node_exporter_open_ports{port="17382"} 1
node_exporter_open_ports{port="7380"} 1
node_exporter_open_ports{port="7381"} 1
node_exporter_open_ports{port="7382"} 1
常见错误 couldn’t get dbus connection Kubernetes 中使用 DaemonSet 部署的 node_exporter ,启用了 systemd 功能监控 ,node_exporter 启动报错:
ts=2023-06-07T04:06:16.429Z caller=node_exporter.go:180 level=info msg="Starting node_exporter" version="(version=1.6.0, branch=HEAD, revision=ff7f9d69b645cb691dd3e84dc3afc88f5c006962)"
ts=2023-06-07T04:06:16.429Z caller=node_exporter.go:181 level=info msg="Build context" build_context="(go=go1.20.4, platform=linux/amd64, user=root@f9c3ed0cfbd3, date=20230527-12:03:54, tags=netgo osusergo static_build)"
ts=2023-06-07T04:06:16.429Z caller=systemd_linux.go:146 level=warn collector=systemd msg="--collector.systemd.unit-whitelist is DEPRECATED and will be removed in 2.0.0, use --collector.systemd.unit-include"
ts=2023-06-07T04:06:16.429Z caller=systemd_linux.go:152 level=info collector=systemd msg="Parsed flag --collector.systemd.unit-include" flag="\"(sshd|docker|cri-docker|crond|iptables|systemd-journald|).service\""
ts=2023-06-07T04:06:16.430Z caller=systemd_linux.go:154 level=info collector=systemd msg="Parsed flag --collector.systemd.unit-exclude" flag=.+\.(automount|device|mount|scope|slice)
ts=2023-06-07T04:06:16.430Z caller=diskstats_common.go:111 level=info collector=diskstats msg="Parsed flag --collector.diskstats.device-exclude" flag=^(ram|loop|fd|(h|s|v|xv)d[a-z]|nvme\d+n\d+p)\d+$
ts=2023-06-07T04:06:16.430Z caller=diskstats_linux.go:265 level=error collector=diskstats msg="Failed to open directory, disabling udev device properties" path=/run/udev/data
ts=2023-06-07T04:06:16.430Z caller=filesystem_common.go:94 level=warn collector=filesystem msg="--collector.filesystem.ignored-mount-points is DEPRECATED and will be removed in 2.0.0, use --collector.filesystem.mount-points-exclude"
ts=2023-06-07T04:06:16.430Z caller=filesystem_common.go:111 level=info collector=filesystem msg="Parsed flag --collector.filesystem.mount-points-exclude" flag="\"^/(sys|proc|dev|host|etc)($|/)\""
ts=2023-06-07T04:06:16.430Z caller=filesystem_common.go:113 level=info collector=filesystem msg="Parsed flag --collector.filesystem.fs-types-exclude" flag=^(autofs|binfmt_misc|bpf|cgroup2?|configfs|debugfs|devpts|devtmpfs|fusectl|hugetlbfs|iso9660|mqueue|nsfs|overlay|proc|procfs|pstore|rpc_pipefs|securityfs|selinuxfs|squashfs|sysfs|tracefs)$
ts=2023-06-07T04:06:16.431Z caller=node_exporter.go:110 level=info msg="Enabled collectors"
ts=2023-06-07T04:06:16.431Z caller=node_exporter.go:117 level=info collector=arp
ts=2023-06-07T04:06:16.431Z caller=node_exporter.go:117 level=info collector=bcache
ts=2023-06-07T04:06:16.431Z caller=node_exporter.go:117 level=info collector=bonding
ts=2023-06-07T04:06:16.431Z caller=node_exporter.go:117 level=info collector=btrfs
ts=2023-06-07T04:06:16.431Z caller=node_exporter.go:117 level=info collector=conntrack
ts=2023-06-07T04:06:16.431Z caller=node_exporter.go:117 level=info collector=cpu
ts=2023-06-07T04:06:16.431Z caller=node_exporter.go:117 level=info collector=cpufreq
ts=2023-06-07T04:06:16.431Z caller=node_exporter.go:117 level=info collector=diskstats
ts=2023-06-07T04:06:16.431Z caller=node_exporter.go:117 level=info collector=dmi
ts=2023-06-07T04:06:16.431Z caller=node_exporter.go:117 level=info collector=edac
ts=2023-06-07T04:06:16.431Z caller=node_exporter.go:117 level=info collector=entropy
ts=2023-06-07T04:06:16.431Z caller=node_exporter.go:117 level=info collector=fibrechannel
ts=2023-06-07T04:06:16.431Z caller=node_exporter.go:117 level=info collector=filefd
ts=2023-06-07T04:06:16.431Z caller=node_exporter.go:117 level=info collector=filesystem
ts=2023-06-07T04:06:16.431Z caller=node_exporter.go:117 level=info collector=hwmon
ts=2023-06-07T04:06:16.431Z caller=node_exporter.go:117 level=info collector=infiniband
ts=2023-06-07T04:06:16.431Z caller=node_exporter.go:117 level=info collector=ipvs
ts=2023-06-07T04:06:16.431Z caller=node_exporter.go:117 level=info collector=loadavg
ts=2023-06-07T04:06:16.431Z caller=node_exporter.go:117 level=info collector=mdadm
ts=2023-06-07T04:06:16.431Z caller=node_exporter.go:117 level=info collector=meminfo
ts=2023-06-07T04:06:16.431Z caller=node_exporter.go:117 level=info collector=netclass
ts=2023-06-07T04:06:16.431Z caller=node_exporter.go:117 level=info collector=netdev
ts=2023-06-07T04:06:16.431Z caller=node_exporter.go:117 level=info collector=netstat
ts=2023-06-07T04:06:16.431Z caller=node_exporter.go:117 level=info collector=nfs
ts=2023-06-07T04:06:16.431Z caller=node_exporter.go:117 level=info collector=nfsd
ts=2023-06-07T04:06:16.431Z caller=node_exporter.go:117 level=info collector=nvme
ts=2023-06-07T04:06:16.431Z caller=node_exporter.go:117 level=info collector=os
ts=2023-06-07T04:06:16.431Z caller=node_exporter.go:117 level=info collector=powersupplyclass
ts=2023-06-07T04:06:16.431Z caller=node_exporter.go:117 level=info collector=pressure
ts=2023-06-07T04:06:16.431Z caller=node_exporter.go:117 level=info collector=rapl
ts=2023-06-07T04:06:16.431Z caller=node_exporter.go:117 level=info collector=schedstat
ts=2023-06-07T04:06:16.431Z caller=node_exporter.go:117 level=info collector=selinux
ts=2023-06-07T04:06:16.431Z caller=node_exporter.go:117 level=info collector=sockstat
ts=2023-06-07T04:06:16.431Z caller=node_exporter.go:117 level=info collector=softnet
ts=2023-06-07T04:06:16.431Z caller=node_exporter.go:117 level=info collector=stat
ts=2023-06-07T04:06:16.431Z caller=node_exporter.go:117 level=info collector=systemd
ts=2023-06-07T04:06:16.431Z caller=node_exporter.go:117 level=info collector=tapestats
ts=2023-06-07T04:06:16.431Z caller=node_exporter.go:117 level=info collector=textfile
ts=2023-06-07T04:06:16.431Z caller=node_exporter.go:117 level=info collector=thermal_zone
ts=2023-06-07T04:06:16.431Z caller=node_exporter.go:117 level=info collector=time
ts=2023-06-07T04:06:16.431Z caller=node_exporter.go:117 level=info collector=timex
ts=2023-06-07T04:06:16.431Z caller=node_exporter.go:117 level=info collector=udp_queues
ts=2023-06-07T04:06:16.431Z caller=node_exporter.go:117 level=info collector=uname
ts=2023-06-07T04:06:16.431Z caller=node_exporter.go:117 level=info collector=vmstat
ts=2023-06-07T04:06:16.431Z caller=node_exporter.go:117 level=info collector=xfs
ts=2023-06-07T04:06:16.431Z caller=node_exporter.go:117 level=info collector=zfs
ts=2023-06-07T04:06:16.431Z caller=tls_config.go:274 level=info msg="Listening on" address=[::]:9100
ts=2023-06-07T04:06:16.431Z caller=tls_config.go:277 level=info msg="TLS is disabled." http2=false address=[::]:9100
ts=2023-06-07T04:06:16.511Z caller=collector.go:169 level=error msg="collector failed" name=systemd duration_seconds=8.649e-05 err="couldn't get dbus connection: dial unix /var/run/dbus/system_bus_socket: connect: no such file or directory"
ts=2023-06-07T04:06:21.499Z caller=collector.go:169 level=error msg="collector failed" name=systemd duration_seconds=4.6418e-05 err="couldn't get dbus connection: dial unix /var/run/dbus/system_bus_socket: connect: no such file or directory"
根据报错提示,应该是 node_exporter 无法访问节点的 /var/run/dbus/system_bus_socket。尝试挂载节点的此目录到 node_exporter 容器中,参考以下配置
containers:
- args:
  - --path.procfs
  - /host/proc
  - --path.sysfs
  - /host/sys
  - --collector.filesystem.ignored-mount-points
  - '"^/(sys|proc|dev|host|etc)($|/)"'
  - --collector.systemd
  - --collector.systemd.unit-whitelist
  - '"(sshd|docker|cri-docker|crond|iptables|systemd-journald|).service"'
  image: prom/node-exporter
  imagePullPolicy: Always
  name: node-exporter
  ports:
  - containerPort: 9100
    hostPort: 9100
    name: http
    protocol: TCP
  resources: {}
  securityContext:
    privileged: true
  terminationMessagePath: /dev/termination-log
  terminationMessagePolicy: File
  volumeMounts:
  - mountPath: /host/dev
    name: dev
  - mountPath: /host/proc
    name: proc
  - mountPath: /host/sys
    name: sys
  - mountPath: /rootfs
    name: rootfs
  - mountPath: /var/run/dbus/
    name: var-run-dbus
    readOnly: true
volumes:
- hostPath:
    path: /proc
    type: ""
  name: proc
- hostPath:
    path: /dev
    type: ""
  name: dev
- hostPath:
    path: /sys
    type: ""
  name: sys
- hostPath:
    path: /
    type: ""
  name: rootfs
- hostPath:
    path: /var/run/dbus/
    type: ""
  name: var-run-dbus
重启 Pod 后,重新观察日志,node_exporter 启动正常。
参考链接 Node Exporter
脚注