Linux CPUs
CPU Architecture and Common Concepts
CPU Architecture
下图展示了一个简单的 CPU 架构图,有一个物理 CPU(Physical Processor),包含 4 个 CPU Cores,每个 CPU Core 包含 2 个 Hardware Threads,总计 8 个 CPUs。右侧的图是这 8 个 CPUs 在操作系统(Operating System)中的视图(也被称为 Logical CPU/Virtual Processor/Virtual Core) [1]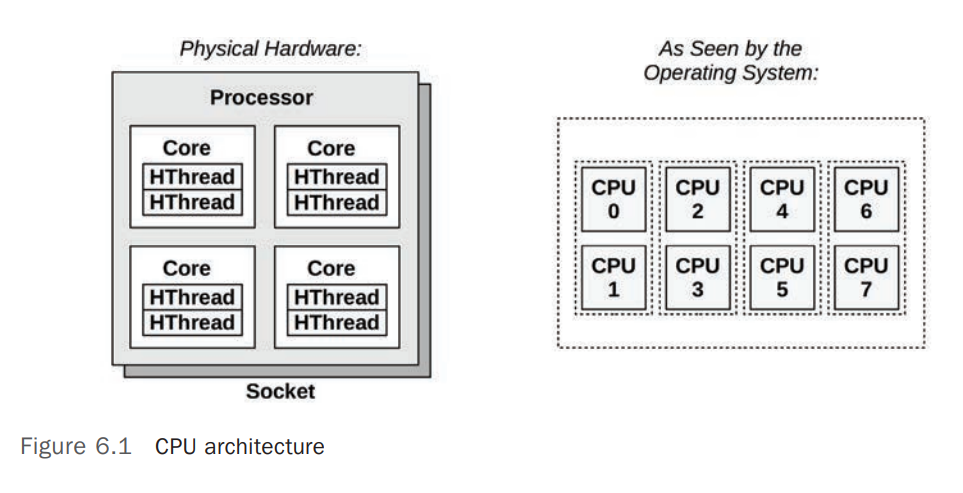
Operating System 可能对于 CPU 的拓扑结构(Topology)有一定程度的了解,如知道哪些 Logical CPU 位于同一个 CPU Core 或者 CPU Cache 是如何被共享的(Shared),这有助于 CPU Scheduler 做出更优的调度决策。
下图展示了通用 2 Core 处理器的组成。具体的组成取决于具体的处理器。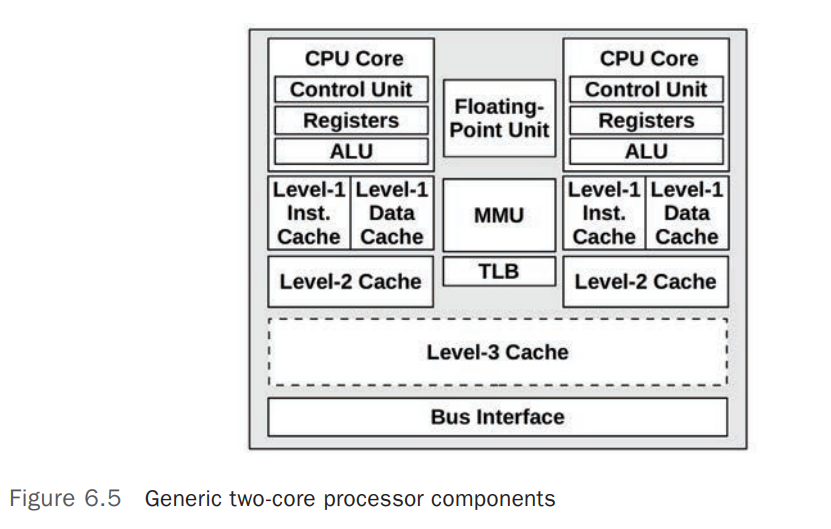
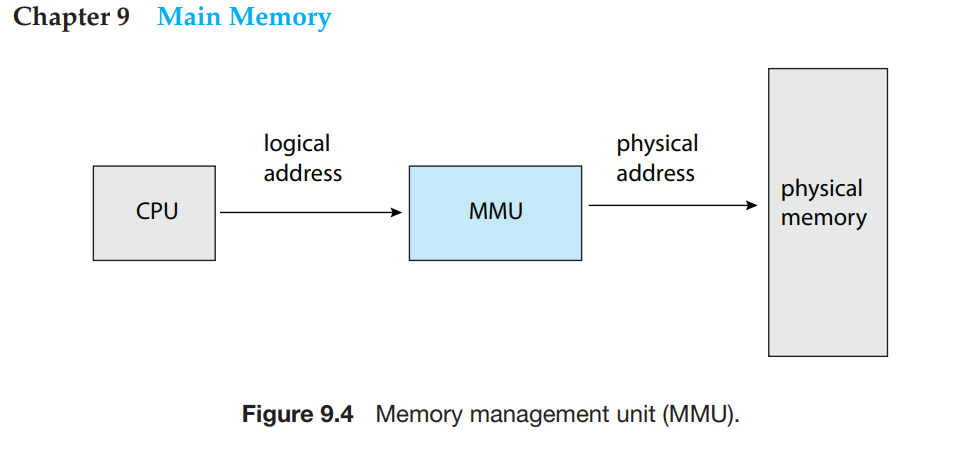
Control Unit是 CPU 处理器的核心组件,负责指令(Instruction)的Fetch、Decoding、Execution并负责保存执行结果(Storing Results)。Shared Floating-Points UnitShared Level-3 CacheMMUMemory Management Unit,负责将虚拟内存地址转换为物理内存地址(Virtual-to-Physical Address Translation)TLBTranslation Lookaside Buffer,用于 Cache 内存地址转换(Virtual-to-Physical Address Translation),未缓存的地址转换需要去 Main Memory 中的 Page Tables 中查询,MMU 的基本构成如下图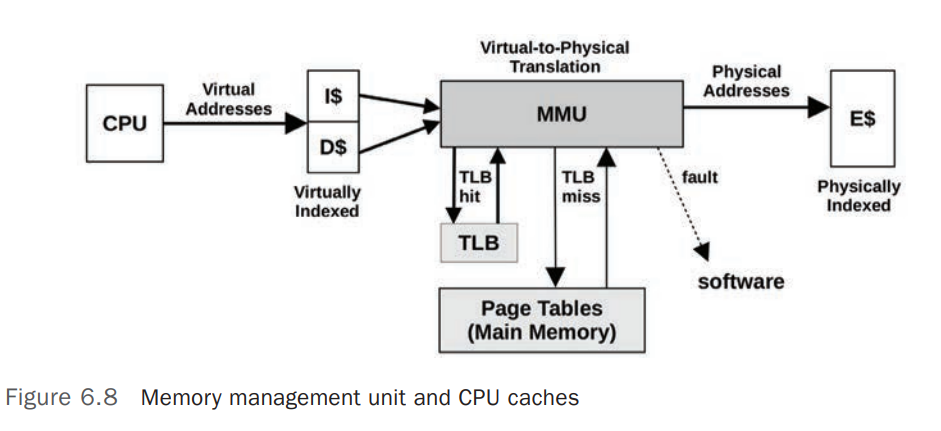
P-States and C-States
Intel 处理器的 ACPI(Advanced Configuration and Power Interface)标准定义了 P-States (Processor Performance States) 和 S-States (Processor Power States) 。 [4]
- P-States 通过在 Processor 运行过程中提供不同的 Clock Rate 提供不同的性能选择。 P0 提供最高级别的性能,P1 到 PN 提供较慢的 Clock Rate,这些级别通常可以被硬件(如依赖处理器温度)或者系统上的软件(如内核的节能策略)控制。
- C-States 提供当 CPU 处于 Idle 时,提供不同的
idle states,用于节省电力(节能),下图列出了常见的 C-States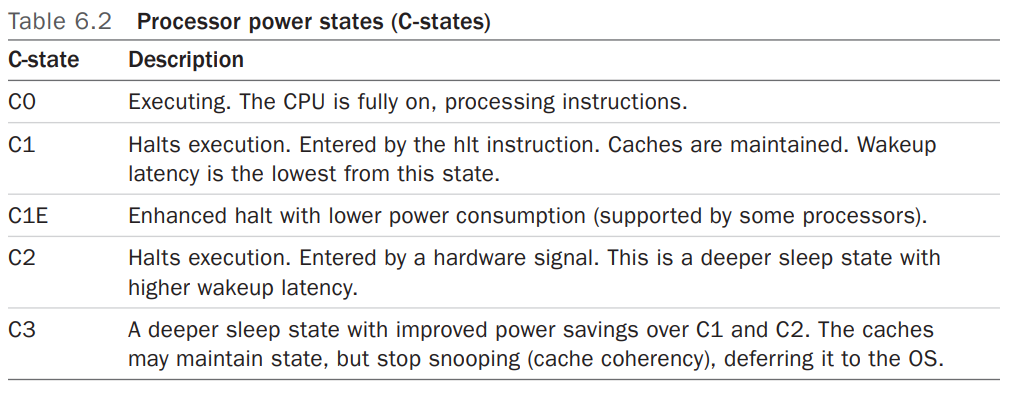
Linux 中可以配置和管理 CPU Status 的方式包括(是否支持取决于不同的 Processor、操作系统和内核版本):
/sys/devices/system/cpu/cpufreq/policy0/scaling_available_governors可以查看可用的 CPU Scaling Governors,一般包括performance、powersave,通过配置/sys/devices/system/cpu/cpufreq/policy0/scaling_governor为对应值。 [6]cpupower工具箱,其中包括cpupower frequency-info、cpupower frequency-set等一系列管理和查看 CPU 频率等信息的工具
CPU Memory Caches
Processors(物理 CPU 处理器)提供了各种个样的硬件缓存(Hardware Caches)用于提高 CPU 读写 Memory I/O 的性能(CPU 的处理速度是 Memory I/O 处理速度的多个量级),下图展示了 Processor Caches 在大小(Sizes)和响应速度之间的关系, 离 Processor 越近,其响应速度越快,存储空间越小,成本越高(贵)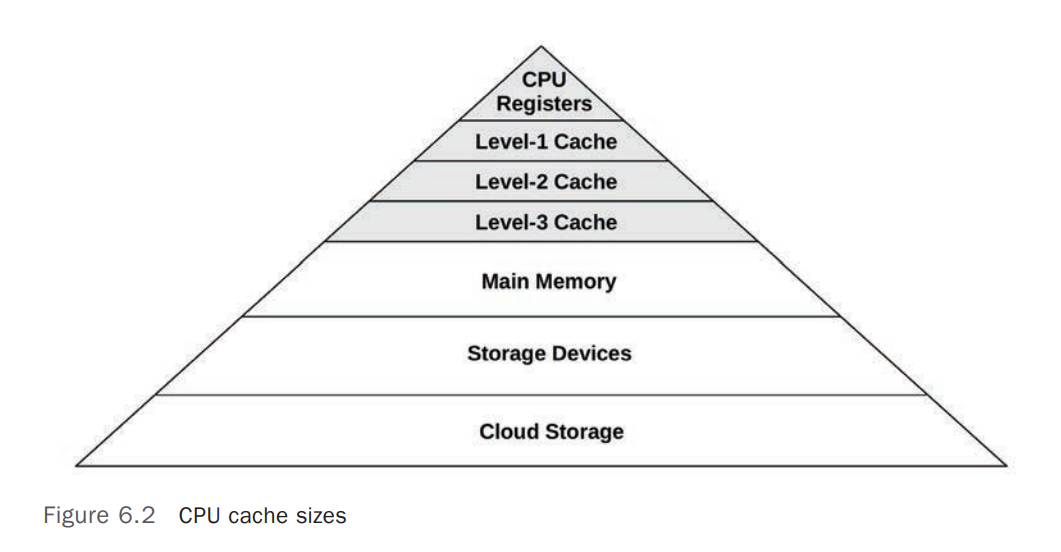
Clock Rate
CPU 时钟频率(Clock Rate) 是指 Processor 每秒跳动(转换)的次数,每一个 Processor 的时钟变化也称为一个 Clock Cycle 。 Processor 通常是以特定的时钟频率运行,比如 4GHz 的 CPU 每秒会进行 4 Billion Clock Cycles。每个 CPU 指令(Instruction)都需要通过一个或者多个 Clock Cycles 来完成。 现代 CPU 通常会变频,即调整 Processor 的 Clock Rate,如果提高 CLock Rate 以提升性能,降低 Clock Rate 以节能 。变频操作通常是通过 OS 请求 Processor 变频或者是 Processor 自动进行变频,比如内核中的 idle 线程通常会要求 CPU 降低其 Clock Rate 以节能。
Clock Rate 是衡量 Processor 能力(Capacity)的一个主要指标。通常来说,较高 Clock Rate 的 Processor 会有更高的性能,但是在性能分析的场景中,提高 CPU 的 Clock Rate 不一定会提高 CPU 性能,这主要取决于 CPU 的 Clock Cycles 到底是在忙于什么,如果 Clock Cycles 主要忙于等待 Memory Access,那么换成更高频率的处理器,并不会提高整个系统的性能。
SMT
Simultaneous Multi-Threading(SMT) 是一种由 Processor 支持的硬件多线程(Hardware Multithreading)技术,用于实现同一个 Processor Core 上的并发(Parallelism),它允许一个 CPU Core 运行多个 Thread,每个 Hardware Thread 从 Operating System 层面来看都是一个 CPU。这种技术的典型应用包括 Intel 的 Hyper-Threading 技术,允许每个 Processor Core 运行 2 个 Threads,以及 POWER8,允许每个 Processor Core 运行 8 个 Threads。
SMT 的实现通常基于 Core 运行指令(Instructions)的过程中的 Stall Cycles,当某个指令处于 Stall Cycles 时,Core 会允许调度另一个指令来运行。基于 Hardware Thread 的 CPU,其性能和单独的 CPU Core 是有区别的,这个差别取决于其上的工作负载(Workload),Stall Cycles 严重的 Workloads 会比 Instruction Cycles 严重的 Workloads 性能更好,因为 Stall Cycles 会减少竞争(Core Contention)