Systems Performance Enterprise and the Cloud v2
性能分析相关的术语
以下为性能分析中常用到的专业术语或指标 [2]
IOPS
Input/Output Operations Per Second. 用于衡量数据传输操作(Rate of Data transfer operations)的频率。对于硬盘 I/O (Disk I/O)来说,指 每秒发生的读写请求 。Throughput
吞吐量 。在网络通信中,主要指 数据传输速率(Data Rate, bytes/bits per second) 。在其他上下文(Contexts,如 Databases),Throughput 通常指 Operation Rate(Operations Per Second or Transactions Per Second)Response Time
响应时间 。一个操作执行到结束的时间。这通常包括 请求等待时间(Waiting Time) 、 被服务时间(Serviced Time) 、 传输时间(Transfer Time)Latency
延迟 。可以指某个操作(Operation)消耗在 等待被处理/服务(Time Waiting to be Serviced/Processed)的时间 。在某些上下文中,等同于 Response Time 。Utilization
使用率 。衡量资源的忙的程度。Saturation
衡量一个资源(如 CPU)的待处理队列中未处理的任务数量。Bottleneck
Workload
一般是客户端请求Cache
SUT
System Under Test 。性能测试目标Off-CPU
Off-CPU 指的是当前不在 CPU 上运行的程序的一种状态。比如在性能分析过程中,需要分析当前不在 CPU 上运行的 Process/Threads 所处的状态,通常包括导致 Task 被 Block 的原因:Disk I/O、Network I/O、Lock Contention、Explicit Sleeps、Scheduler Preemption等
Thread State Analysis
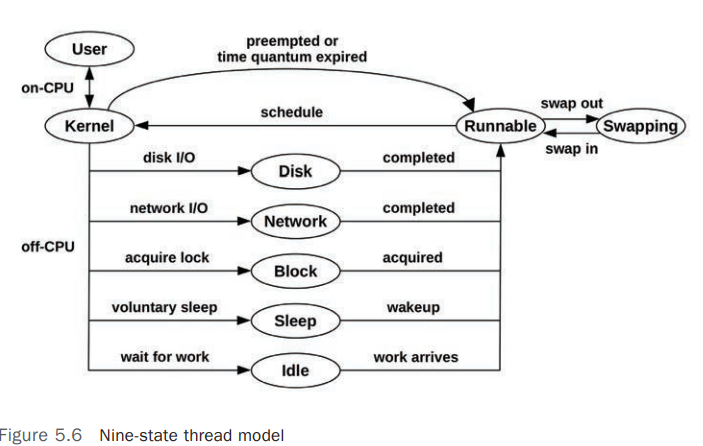
在进行性能分析的过程中,特别是 Application Performance Analysis,首先要清楚 Process/Thread/Task 所处的当前状态,至少可以将其划分为 2 个状态: [8]
- On-CPU
- Off-CPU
更详细的状态划分可以参考以下状态:
User: On-CPU ,用户模式(User Mode)Kernel: On-CPU,Kernel 模式Runnable: Off-CPU,正在等待调度到 CPU(等待变为 On-CPU)Swapping: Runnable,但是被Page-In阻塞(Blocked)Disk I/O: 等待 Block Device I/ONetwork I/O: 等待网络 I/O,如 Sockets 读/写Sleeping: 自愿睡眠状态(Voluntary Sleep)Lock: 等待获取锁Idle: 等待工作(Waiting for work)
Observability Tools
Linux 系统各个部分相关的监控工具如下图: [3]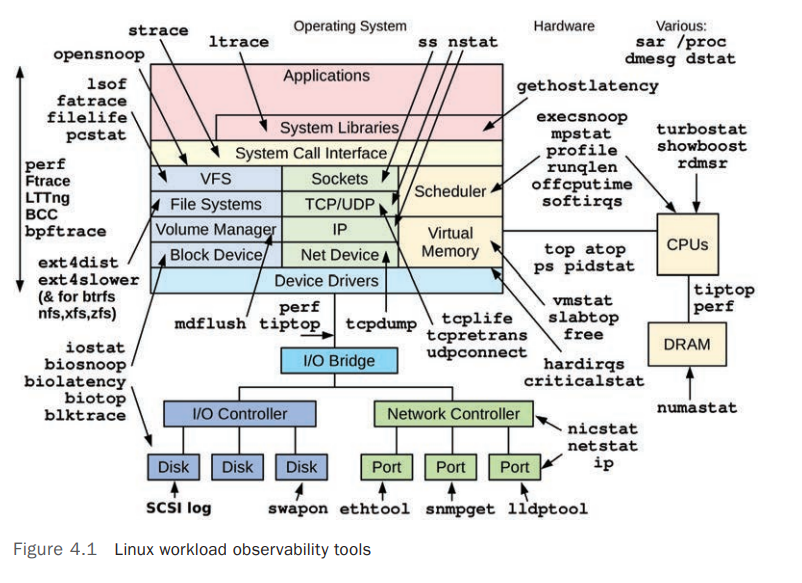
Linux Static Performance Tuning Tools: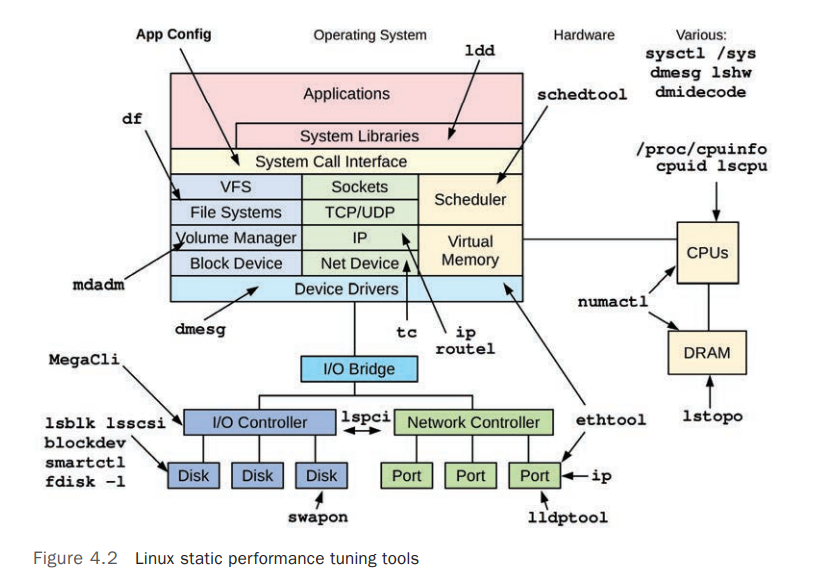
System Wide Observability Tools
以下的观测/统计工具主要读取内核提供的计数器(Counters),展示的是系统全局的统计数据 [3]
| Tools | Descriptions | Examples |
|---|---|---|
vmstat |
系统级别的监测工具,查看系统上 Virtual Memory 和 Physical Memory 的统计数据 | vmstat 命令参考 |
mpstat |
查看每个/部分/全部 CPU 的状态统计数据 | |
iostat |
Disk I/O 使用情况统计,统计数据来自 Block Device Interface | |
nstatrtacct |
读取内核 SNMP 计数器和网络接口(Network Interfaces)统计数据 | |
sar |
System Activity Report 服务导出的统计数据 | sar 命令参考 |
Per-Process Observability Tools
以下的观测工具针对 Process(Process-oriented),主要是读取内核为每个 Process 维护的计时器(Counters)统计数据,他们主要从 /proc 内存文件系统读取数据 [3]
| Tools | Descriptions | Examples |
|---|---|---|
ps |
展示进程状态及统计数据,如 Process 使用的 CPU 、内存等 | |
top |
展示资源使用较高的进程信息,默认按照 CPU 使用率排序 | |
pmap |
列出进程的 Memory Segments 使用情况 |
Profiling Tools
Profiling 通过对目标系统的行为进行采样(Samples)或者快照(Snapshot)进而收集到其特征数据。 [4]
CPU 的使用情况通常是 Profiling 的目标,通过对 CPU 指令点和其堆栈跟踪采样进而描述出其 CPU 路径(CPU Code Path),采样通常以固定频率(如 100Hz)在所有 CPU 上进行并持续一段时间(如 1m)。
以下为常用的 Profiling 工具
| Tools | Descriptions | Examples |
|---|---|---|
perf |
标准的 Linux Profiler,包括 Profiling 命令行 | |
profile |
基本 BPF 的 CPU Profiler | |
Intel VTune Amplifier XE |
适用于 Linux 和 Windows 的 Profiling 工具,有图形界面 | |
gprof |
面向 Process (process-oriented)的 Profiler 。GNU Profiling 工具,用于分析编译器添加的 Profiling Information | |
cachegrind |
可以 Profile 硬件缓存的使用情况(Hardware Cache Usage)并使用 kcachegrind 图形化结果 |
|
Java Flight Recorder(JFR) |
针对 JAVA 的 Profiler |
Tracing Tools
Tracing 使用工具追踪到目标系统的每个事件,并将其存储下来以便事后分析。和 Profiling 相比,Tracing 会记录下目标系统的所有事件,而不仅仅是对其进行采样,相比 Profiling,Tracing 会导致额外的 CPU、内存和存储消耗,因此可能会导致目标系统性能下降,在性能分析时,需要考虑 Tracing Tools 引入的性能影响
以下为常用的 Tracing 工具
| Tools | Descriptions | Examples |
|---|---|---|
tcpdump |
跟踪网络报文 ,使用 libpcap |
|
biosnoop |
Block I/O Tracing,使用 BCC 或者 bpftrace |
|
execsnoop |
New Processes Tracing ,使用 BCC 或者 bpftrace |
|
perf |
标准的 Linux Profiler,也可用于 Tracing | |
perf trace |
特殊的 perf 子命令,用于跟踪系统全局的系统调用(System-wide System Calls) |
|
Ftrace |
Linux 内置的 tracer | |
BCC |
基于 BPF 的 Tracing Library 和 Toolkit | |
bpftrace |
基于 BPF 的 Tracer 和 Toolkit | |
strace |
System Call Tracing | |
gdb |
代码级别的调试工具 |
Linux Observability Sources
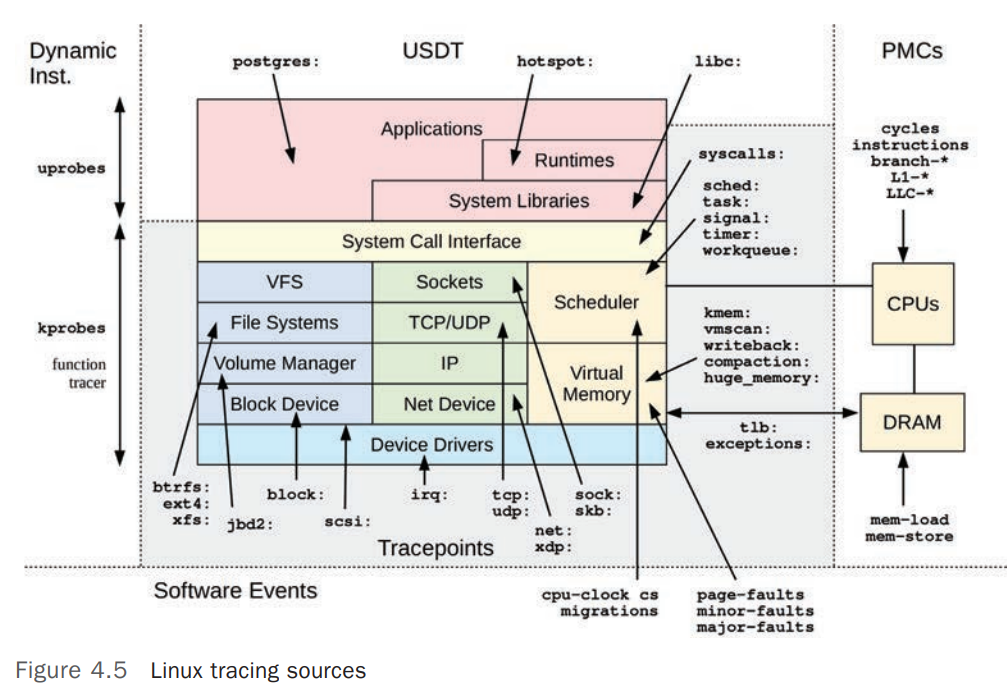
下表列出 Linux 上常用的内核提供的供各种监测工具使用的接口 [5]
| Type | Source | Examples |
|---|---|---|
| Per-Process Counters | /proc/ |
ps /proc/ 目录说明参考 |
| System-wide Counters | /proc//sys/ |
ps |
| Device Configuration and Counters | /sys/ |
|
| Cgroup Statistics | /sys/fs/cgroup/ |
|
| Per-process Tracing | ptrace |
|
| Hardware counters (PMCs) | perf_event |
|
| Network Statistics | netlink |
|
| Network Packet Capture | libpcap |
tcpdump |
| Per-thread Latency Metrics | Delay accounting | |
| System-wide Tracing | Function profiling (Ftrace), tracepoints, software events, kprobes, uprobes, perf_event |
Tracepoints
Tracepoints 是基于 Static Instrumentation 的 Linux Kernel Event Source,Tracepoints 是硬编码(Hard-coded)在内核代码中的某个逻辑点,例如 Syscall 的开始和结束。 [6]
可用的 Tracepoints 可以使用 perf list 命令列出
perf list |
kprobes
kprobes 是 kernel probes 的简称,是为基于 Dynamic Instrumentation 的 Tracer 提供的 Linux Kernel Event Source. kprobes 可以跟踪(Trace)任意的内核函数(Kernel Function)或者指令(Instruction),Linux 2.6.9 引入。
uprobes
uprobes 是 user-space probes 的简称,和 kprobes 类似,只是用于 User Space(User Mode)。
Hardware Counters
CPU 和其他硬件设备通常内置了为观测性能活动而配备的计数器。如 CPU 专用的性能计数器也被称作:
- PMCs : Performance Monitoring Counters
- CPCs: CPU Performance Counters
- PICs : Performance Instrumentation Counters
- PMU events: Performance Monitoring Unit events
他们都是专为 CPU 配备的可编程的硬件寄存器(Programmable Hardware Registers),用于提供底层的 CPU 循环(CPU Cycle)的性能形象。
Application Performance Techniques
要提高应用程序的性能,通常可以从以下方面考虑:
- 选择合适的 I/O Size
- Caching
- Buffering
- Polling
- Concurrency
- Parallelism
- Non-Blocking I/O
- Processor Binding
IO Size
I/O 操作涉及到的开销包括:
- Initializing Buffers
- Making a System Call
- Mode or Context Switching
- Allocating Kernel Metadata
- Checking Process Privileges and Limits
- Mapping Address to Device
- Executing Kernel and Driver Code to deliver I/O
- Freeing Metadata and Buffers
对于 初始化 Buffers 的开销(Tax)来说,小的 I/O Size 和大的 I/O Size 是一样的,因此从效率上来说,每个 I/O 传输的数据越多越好。 [7]
增加 I/O Size 通常是提高应用程序吞吐量(Throughput)的常用策略,从效率上说,在一个 I/O 中传输 128 Kbytes 要比使用 128次的 I/O(每次传输 1 Kbytes)更高效。每个 I/O 都有固定的开销,特别是机械硬盘(Rotational Disk),因为需要寻址时间(Seek Time)有更大的开销。
太大的 I/O Size 也可能会导致 Applications 性能下降,例如一个 Application,其对 Database 的请求符合 8 Kbyte 的随即读取,如果使用 128 Kbyte 的 Disk I/O,那每次请求中都会有 120 Kbytes 的浪费,为了选择符合请求的数据大小的 I/O Size,这会导致延迟(Latency)增加,不需要的大 I/O Size 也会导致 Cache Space 的浪费。
CPU
Flame Graphs
Flame Graphs(火焰图)是一种展示 CPU 性能的 Profile 方法。可以帮助我们找到 CPU 性能瓶颈并进行优化。它展示的不仅仅是 CPU 问题,还能根据 CPU 的使用路径(footprints)找到隐藏在 CPU 之后的问题,如 锁争用(lock contention) 问题可以通过在旋转路径(spin path)中查找 CPU time、 内存问题 可以通找到内存分配函数(malloc())过度使用 CPU 时间进行分析,进而找到对应的导致问题的代码路径。
Linux Perf Analysis in 60 Seconds
下表列出了在检查性能问题的最初的 60s 内可以执行的检查,这些检查都是基于 Linux 上的基础工具 [1]
| # | Tool | Check | Refer |
|---|---|---|---|
| 1 | uptime |
检查系统负载,确定系统负载变化(增加或者减少) | |
| 2 | dmesg -T journalctl -k |
检查内核日志中的错误信息,如 OOM 等 | |
| 3 | vmstat -SM 1 |
系统级别的统计数据,包括 运行队列长度(run queue length),swapping,CPU 使用率等 |
|
| 4 | mpstat -P ALL 1 |
每个 CPU 的负载情况 | |
| 5 | pidstat 1 |
每个任务(Per-process)的 CPU 使用率 | |
| 6 | iostat -sxz 1 |
硬盘 IO 统计: IOPS、吞吐量(Throughput)、Average Wait Time、Percent Busy | |
| 7 | free -m |
内存使用情况 | |
| 8 | sar -n DEV 1 |
网络设备 IO 统计 | |
| 9 | sar -n TCP,ETCP 1 |
TCP 统计: Connection Rates、Retransimits | |
| 10 | top htop |
整体检查 |
Stack
针对以下的 Linux Kernel Stack,显示了 TCP 传输(Transmission)过程
tcp_sendmsg+1 |
堆栈跟踪信息一般是 自上而下(Leaf-to-root) 的打印,即第一行展示的是当前正在执行的函数的信息,依次而下是其之前执行的命令。在以上的示例中,当前正在执行的是 tcp_sendmsg 函数,其由 sock_sendmsg 函数调用执行。函数名称右侧的数值 表示指令偏移量(Instruction Offset)。这个 Offset 通常只在需要分析或查阅底层代码逻辑时需要。
Instruction offset(指令偏移量) 相对于某个基准位置(例如当前指令或当前内存位置)的偏移量,表示要访问的内存地址或指令地址的相对距离。通过这种方式,处理器可以更高效地计算跳转目标地址,减少指令中存储目标地址的空间需求,并增强代码的灵活性和可移植性。
通过 从下而上 的阅读堆栈信息,可以跟踪到程序的执行路径,理解当前的指令是如何被调用。
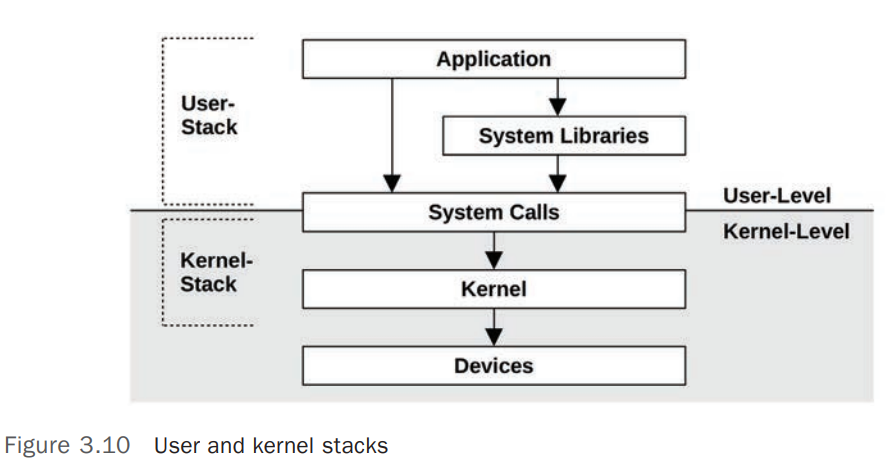
User Stack and Kernel Stack
当进程(Process)处于 Kernel Space 中运行时,即执行 Syscall 的过程中,Process/Threads 有 2 个 Stack:
- User-level Stack : 在 Process/Thread 执行 Syscall(运行于 Kernel Space)时,
User-level Stack是不变的,因为此时 Process/Thread 会运行在分离的 Kernel-level Stack 中 - Kernel-level Stack :
参考链接
Systems Performance: Enterprise and the Cloud v2